Every button, dot and colour, explained.
Plain language, one section per indicator and panel, each with a screenshot from the real app. If you have not opened the terminal yet, do that first and keep it in another tab while you read.
Getting started
Open the terminal. Nothing to install. Sign in, pick an exchange and symbol, and it starts drawing within a second or two.
What you are looking at, in one sentence: colour shows where big orders are waiting, dots show where trades actually happened. Everything else on this page is detail on top of that.
Do these three things first:
- Pick an exchange and a symbol. Binance USD-M perpetuals on BTCUSDT has the deepest book and is the best one to learn on. If it never connects, your own network is probably blocking Binance — switch to Bybit or Coinbase (see troubleshooting).
- Leave price per row on auto. It picks a sensible row height for the instrument on its own.
- Drag the sensitivity slider until most of the chart is dark and only the big orders glow. That is the whole job of the slider: make the important things stand out.
Every setting is remembered between visits, so the chart comes back looking the way you left it.
The workspace
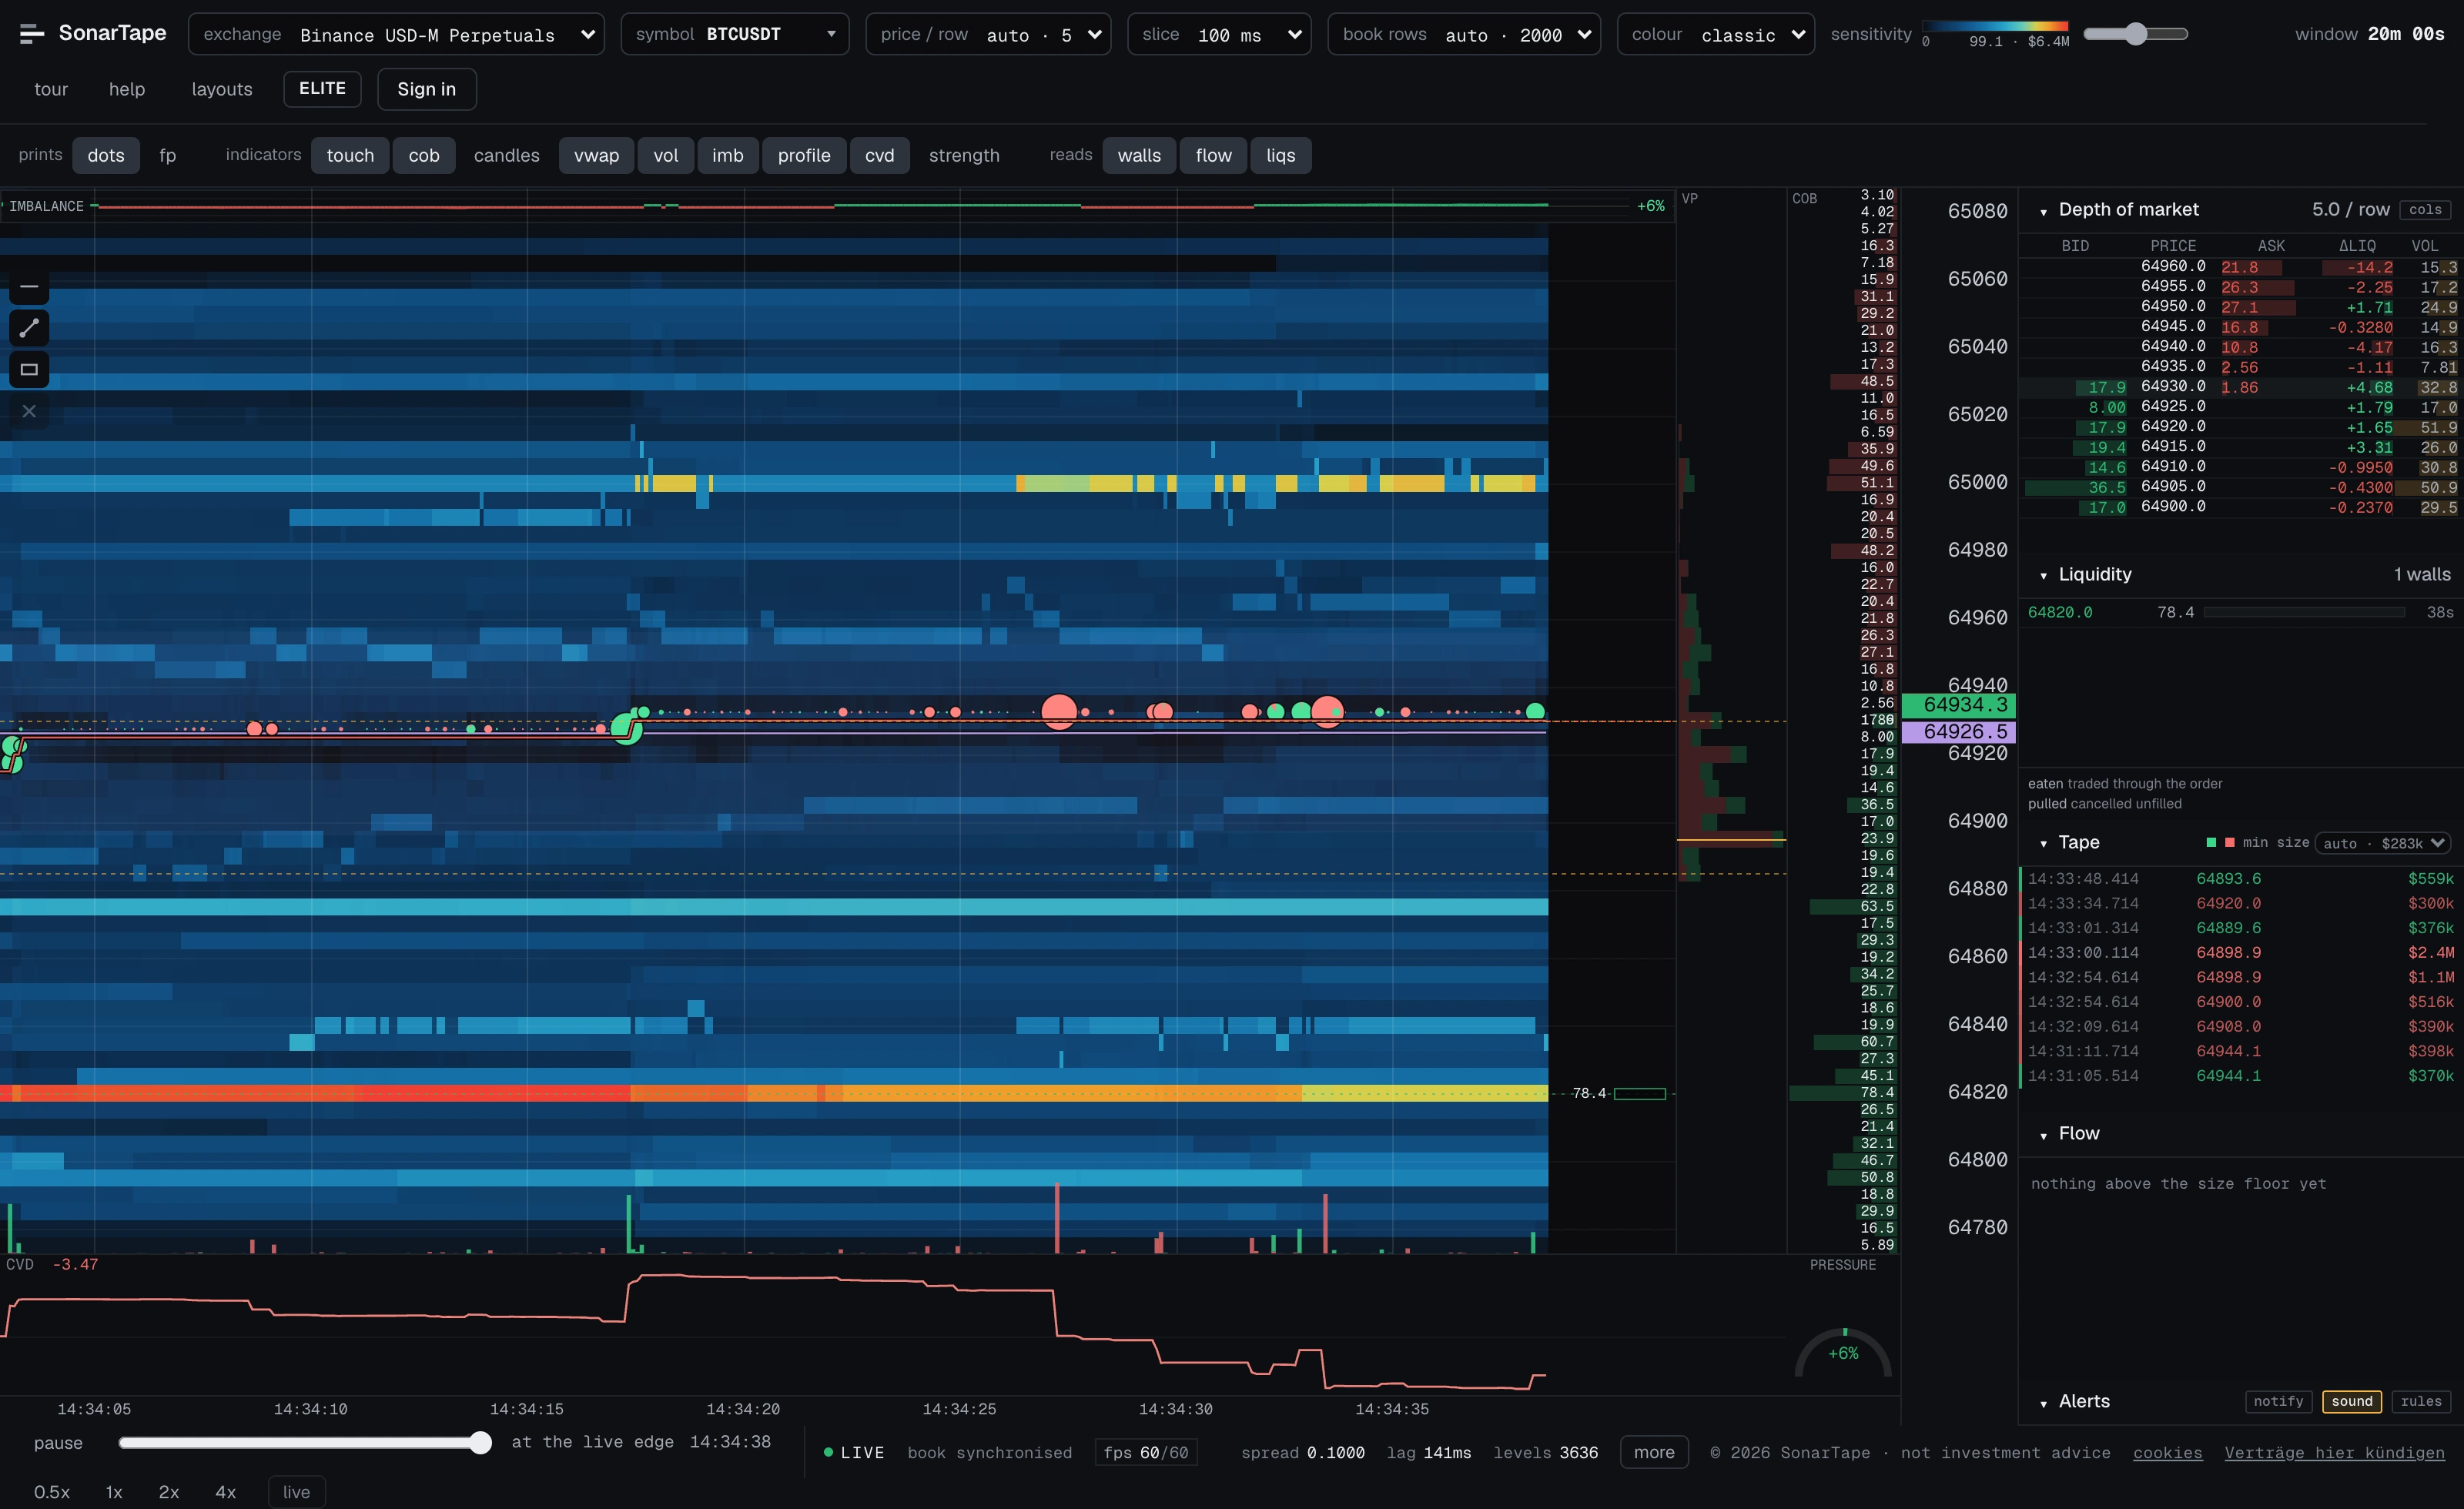
One chart, a column of panels beside it, a transport bar and a status bar along the bottom. They all read the same data, so they always agree with each other.
| Panel | What it shows |
|---|---|
| Chart | The main view: waiting orders as colour, trades as dots, plus the overlays. |
| Depth of market | The order book as a list, at the same prices as the chart. Details. |
| Liquidity | Big orders ("walls") while they sit, and what happened to them. Details. |
| Tape | Every trade, newest first, with its dollar value. Details. |
| Flow | Automatic alerts: big trades, absorption, icebergs, sweeps. Details. |
| Alerts | Your standing rules over those alerts, and what has matched. Details. |
| Transport | Pause, rewind and replay the chart. Details. |
| Status bar | Connection, speed and feed health. Details. |

Saved layouts
The layouts button in the toolbar saves the current setup — which instrument, and every toolbar setting — under a name. Clicking a saved layout puts the whole workspace back the way it was, from any browser you are signed in on.
Saving under a name that already exists overwrites it. How many you may keep is a plan limit; the × beside a name deletes it.
Reading the heatmap
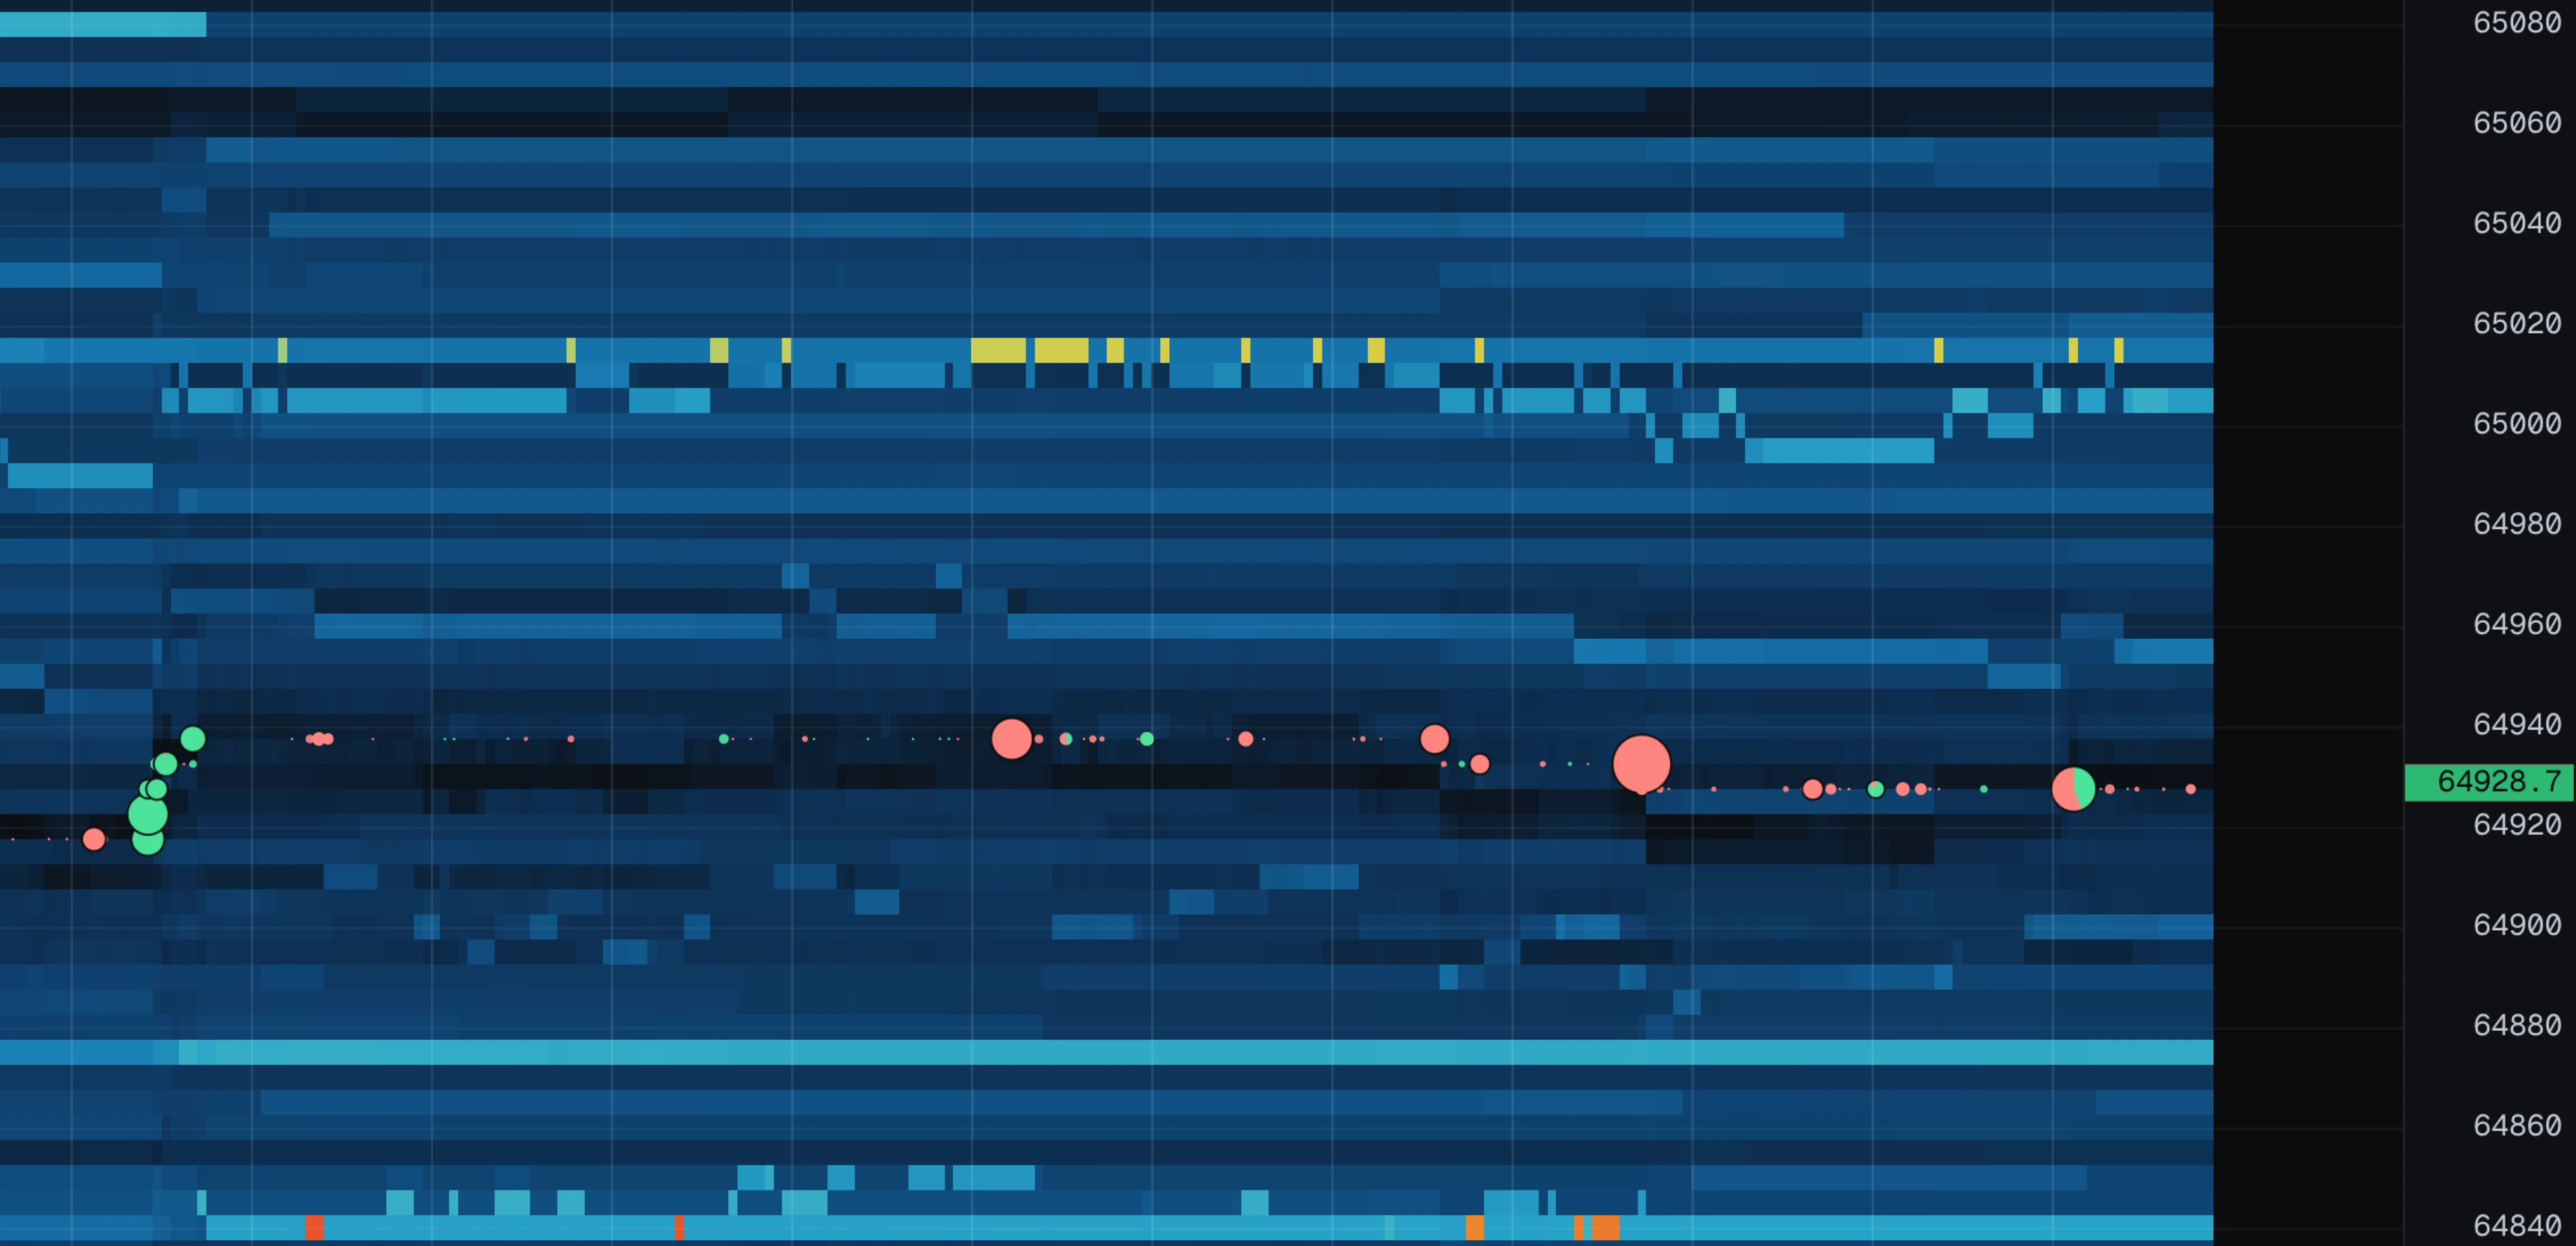
The chart is a grid. Time runs left to right, price runs bottom to top. Each small box answers one question: how much order size was waiting at this price, at this moment?
- Bright colour = a big order is resting at that price.
- Dark = little or nothing is resting there.
Four patterns cover almost everything you will ever see:
| What you see | What it means |
|---|---|
| A horizontal streak | An order sat at one price and nobody touched it. Longer = sat there longer. Brighter = bigger. |
| A streak that ends suddenly | The order was cancelled, or price moved away from it. The liquidity panel tells you which one it was. |
| A streak that ends in dots | Trades kept hitting the order until it broke. It was eaten, not cancelled — a level that was defended and lost. |
| A diagonal band | Orders that move with the price as it drifts. Most of the book looks like this, and it is not interesting. |
What the colours actually mean
The scale adjusts itself. The chart looks at the biggest orders currently resting and treats those as "the top of the scale"; everything else gets a colour underneath. So "bright" always means "among the biggest things in the book right now", and the chart stays readable whether the market is quiet or frantic.
One tip worth more than the rest of this section: watch change, not colour. "A bright band just appeared here" or "this band has taken hits for three columns and is still there" is the useful signal. A bright band that has always been there is not.
The colour scale
Two things decide what the colours mean: an automatic reference, and a sensitivity slider that you control.
The reference (automatic)
The chart continuously looks at the largest orders resting right now and calls that "the top of the scale". Everything else is graded below it. When the market's biggest orders change size, the reference follows — slowly, on purpose, so the history behind you does not flicker.
Sensitivity (yours)
The slider decides how easily something lights up:
- Drag it up: only the very largest orders are bright. Use this when everything looks orange.
- Drag it down: ordinary orders light up too. Use this when the chart looks too dark and empty.
The number next to the slider tells you what the brightest colour means, in the coin and in dollars. When you see a bright band, you can read off roughly how big it is — "$7.9M sitting here" instead of "orange".

Palettes
The colour menu changes which colours mean "big". All ten palettes carry the same information — pick the one your eyes like:
| Palette | Colours |
|---|---|
| classic | Dark blue for small, through cyan and yellow, to orange and red for the largest. The default. |
| sonar | The chart's own background for the smallest, rising through purple and teal into green and a bright yellow peak. Brightness climbs the whole way rather than singling out a hot end, which is what suits reading a shape over price and time. |
| heat | Black through teal and green, to orange and red. Classic thermal look. |
| ice | Black through blue to near white. Brightness alone carries the meaning. |
| mono | Black through grey to white. No colour at all; good for colour blindness. |
| viridis | Dark purple through teal and green to yellow. Perceptually uniform, easy on colour blindness. |
| inferno | Black through purple and red to pale yellow. High contrast at the hot end. |
| plasma | Dark purple through magenta and orange to yellow. |
| ember | Black through deep red and orange to gold. The whole scale inside the fire. |
| acid | Black through green to lime. One hue graded by brightness, phosphor terminal style. |
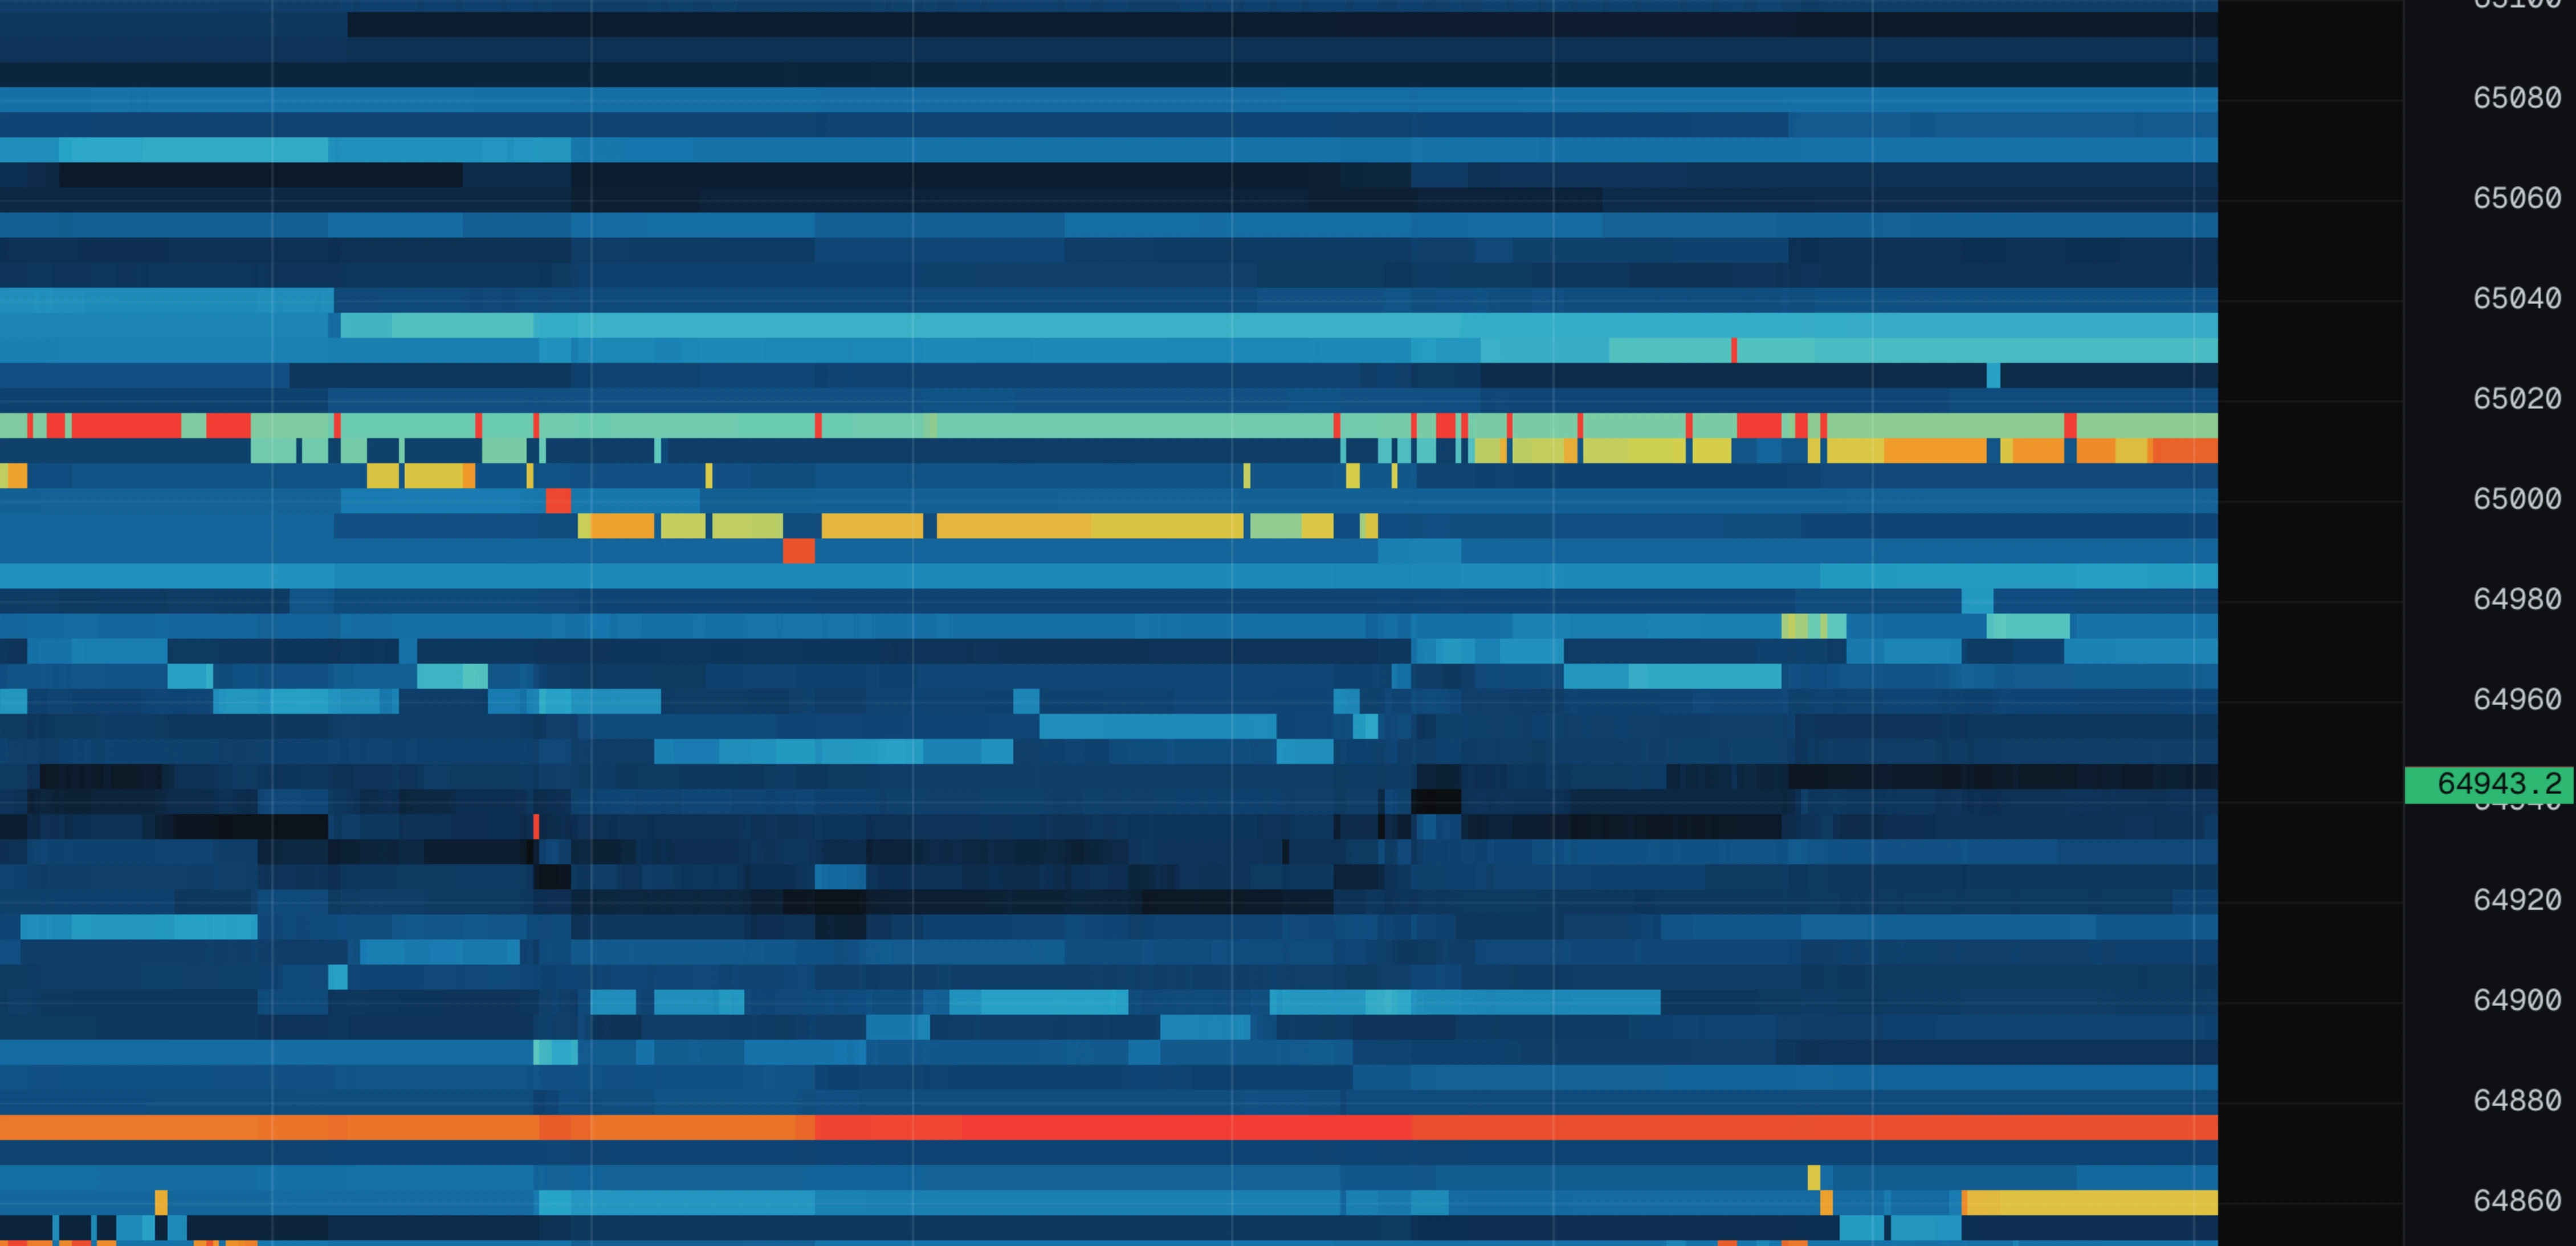
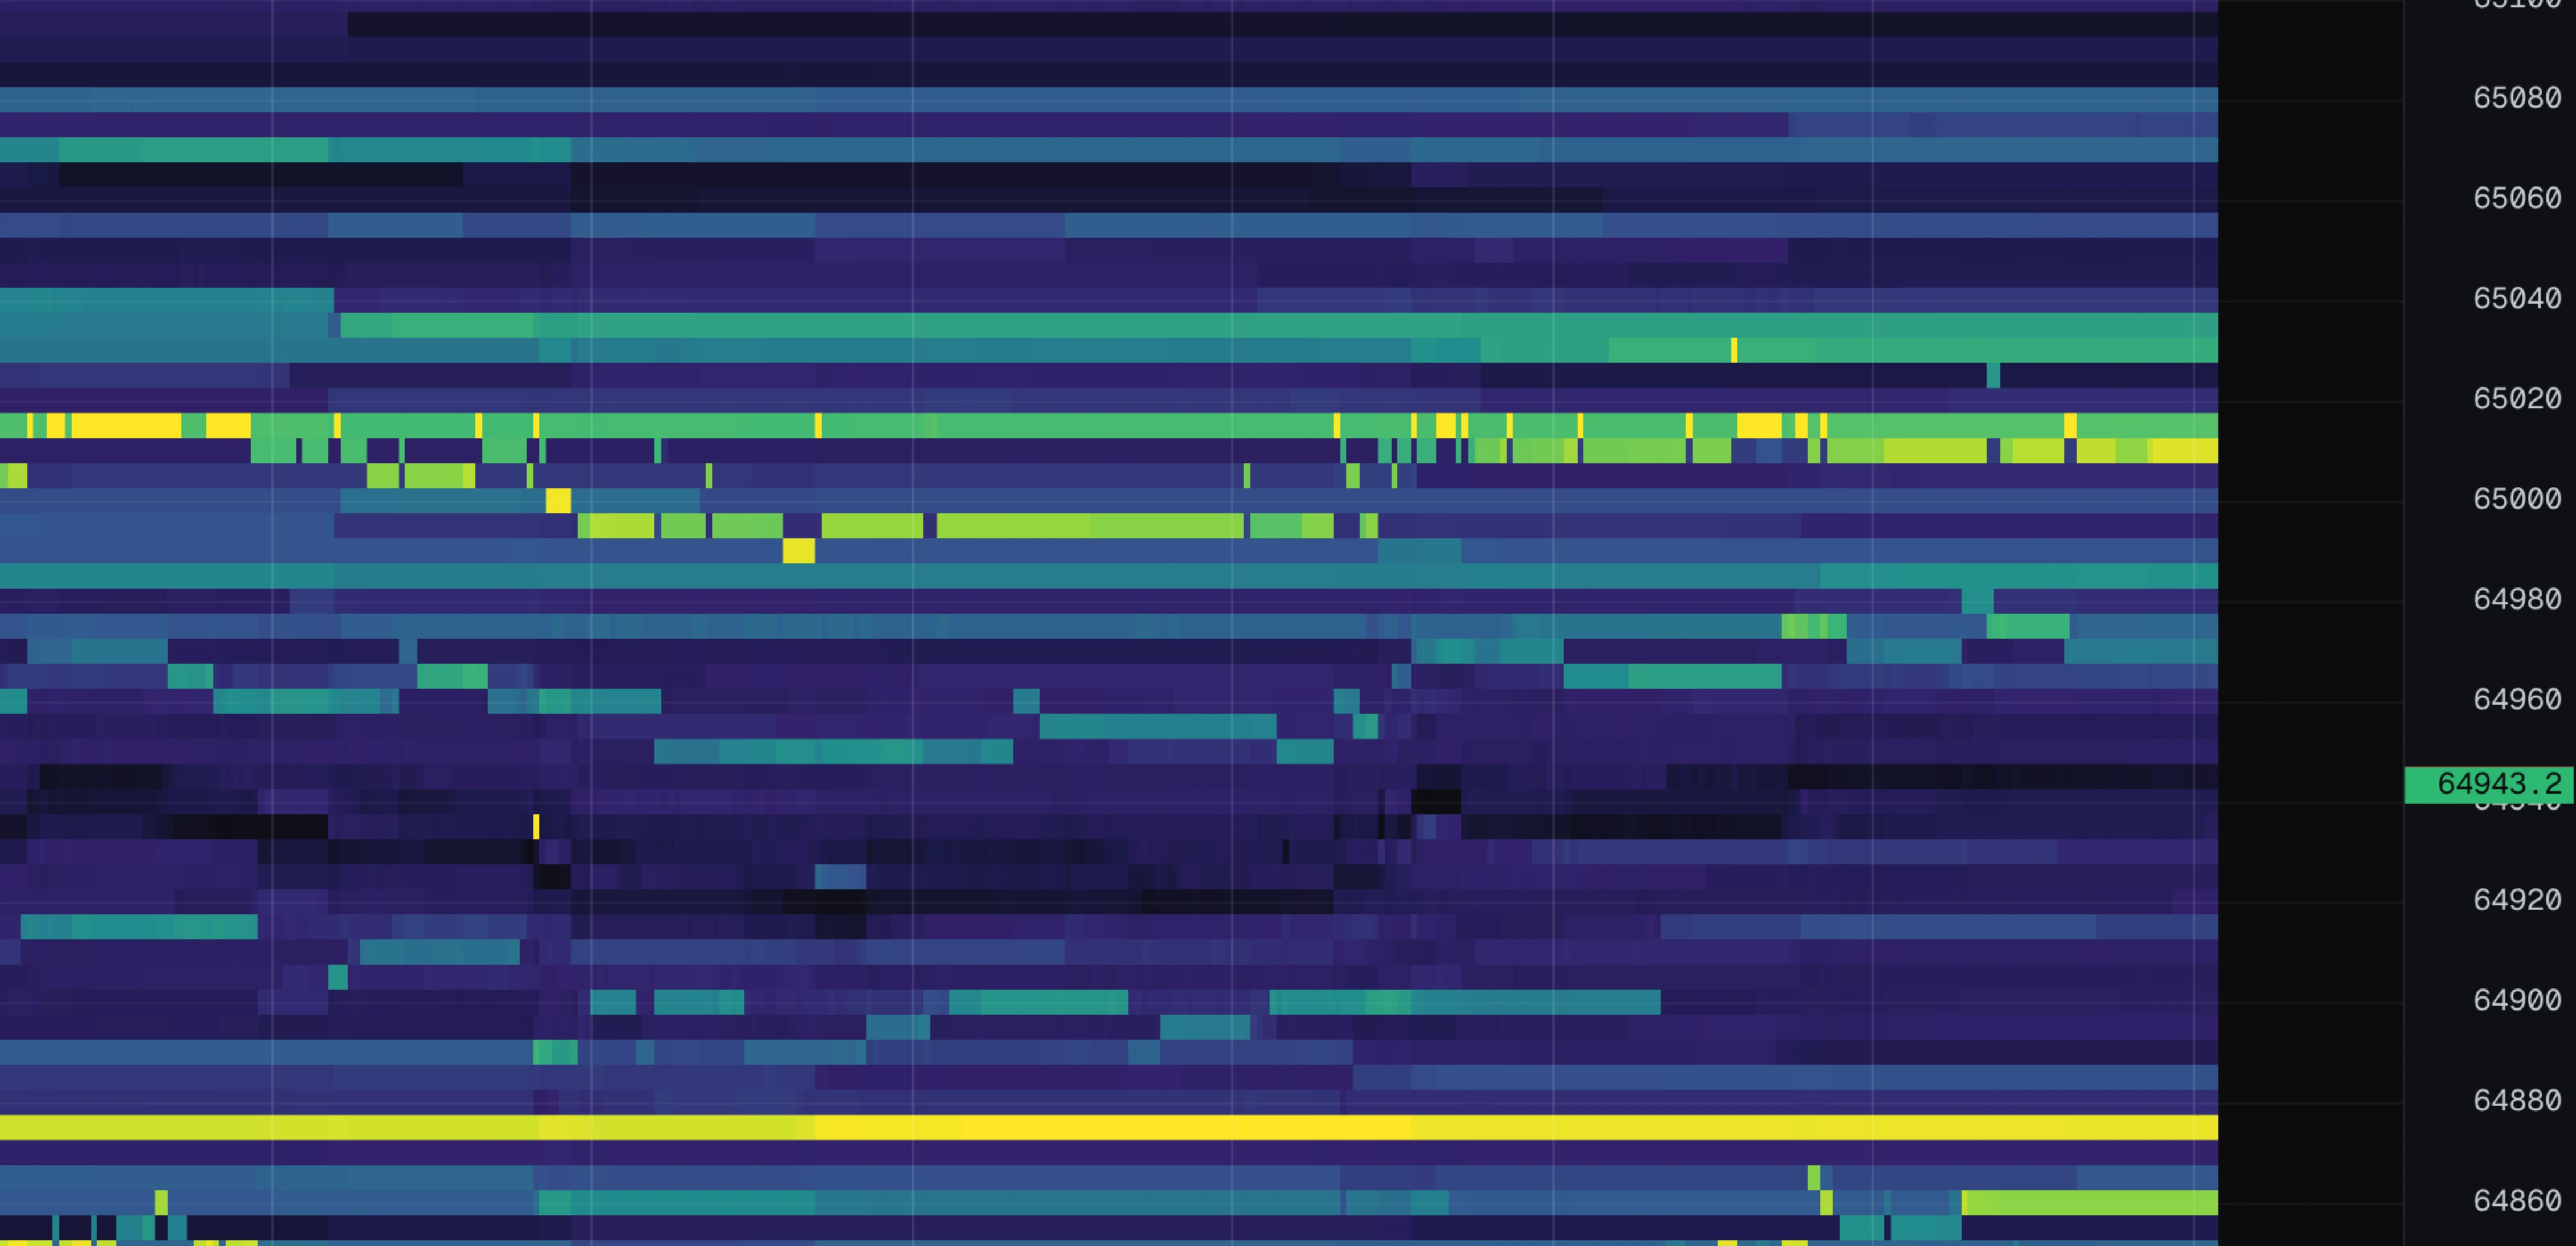
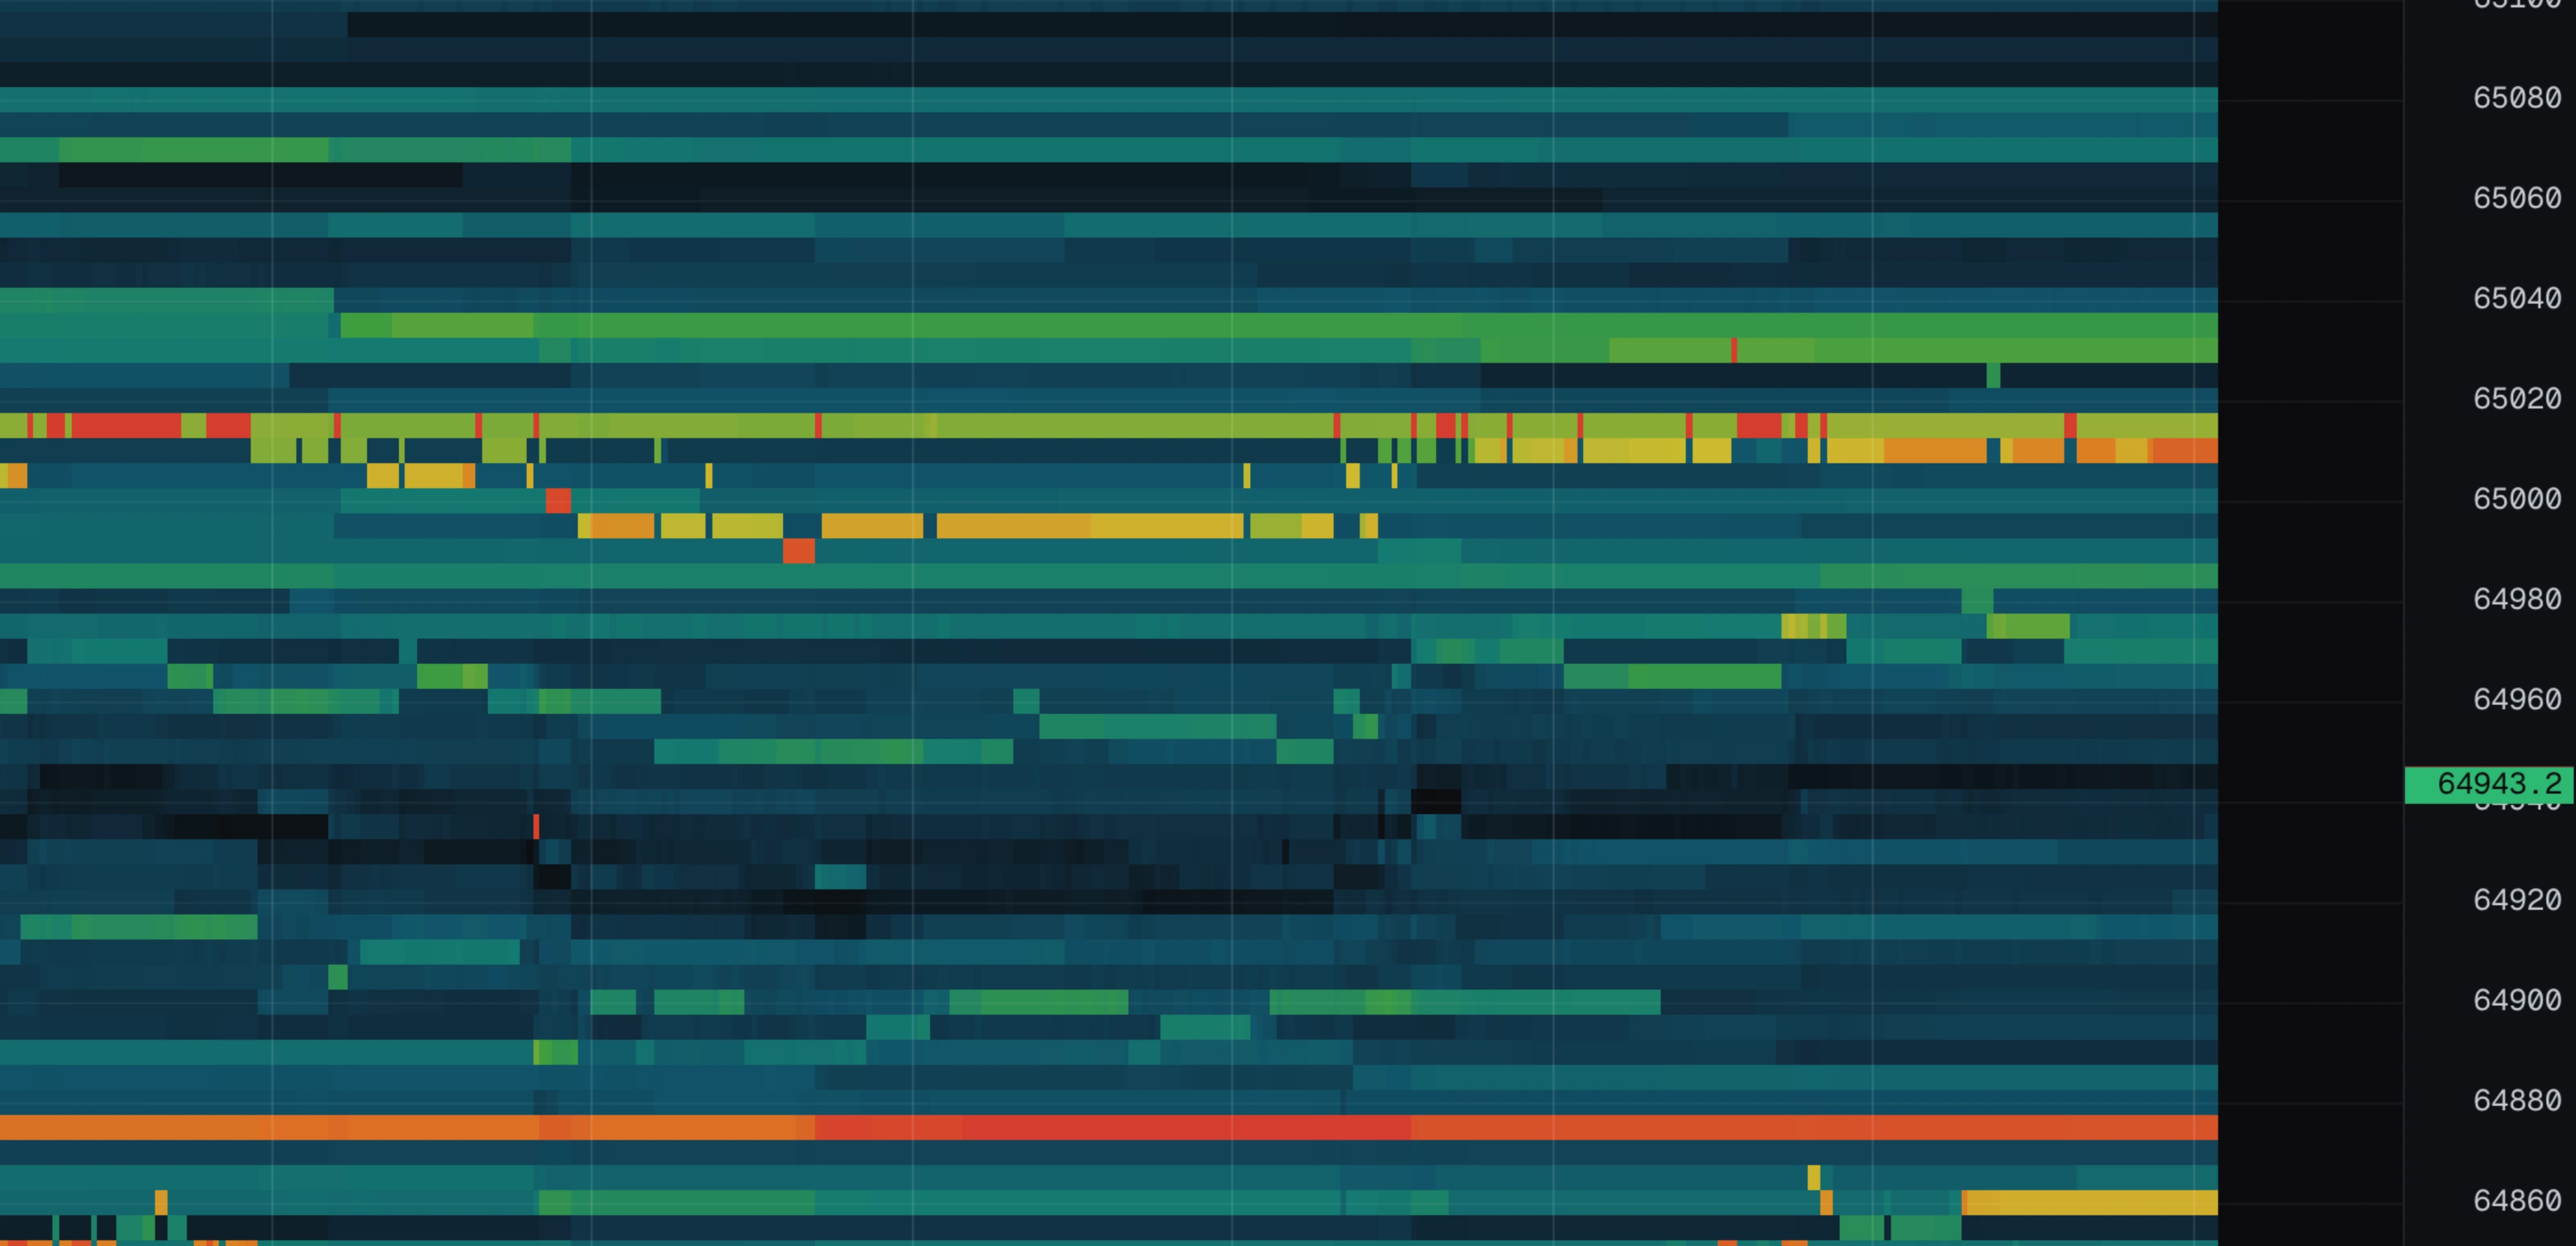
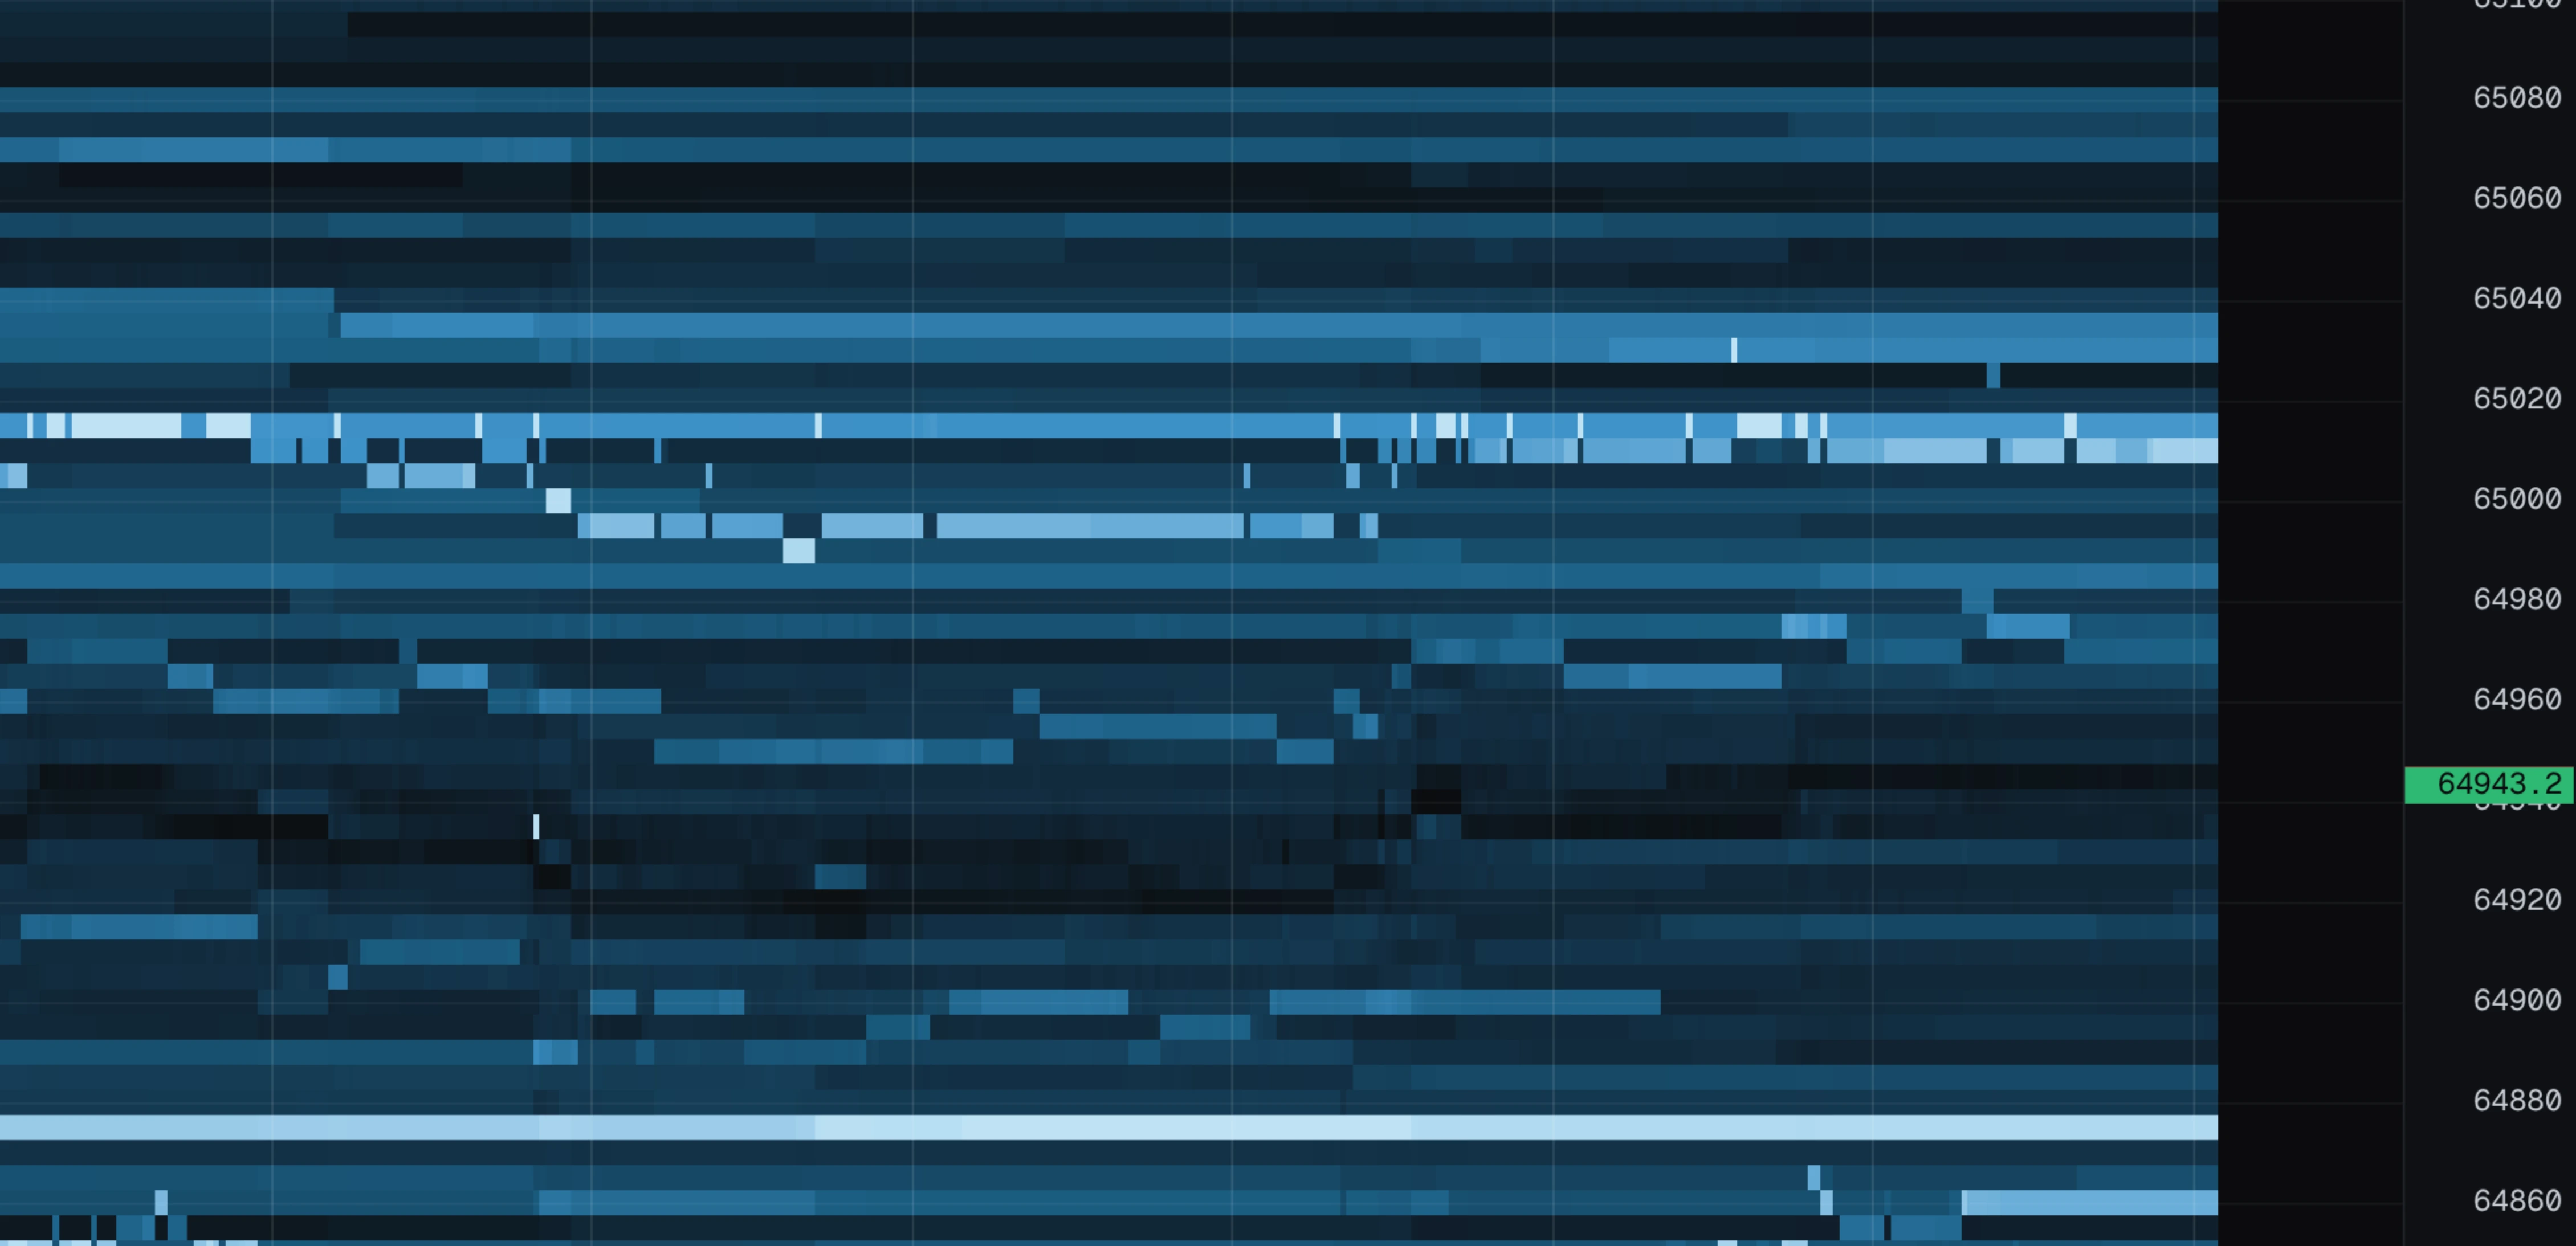
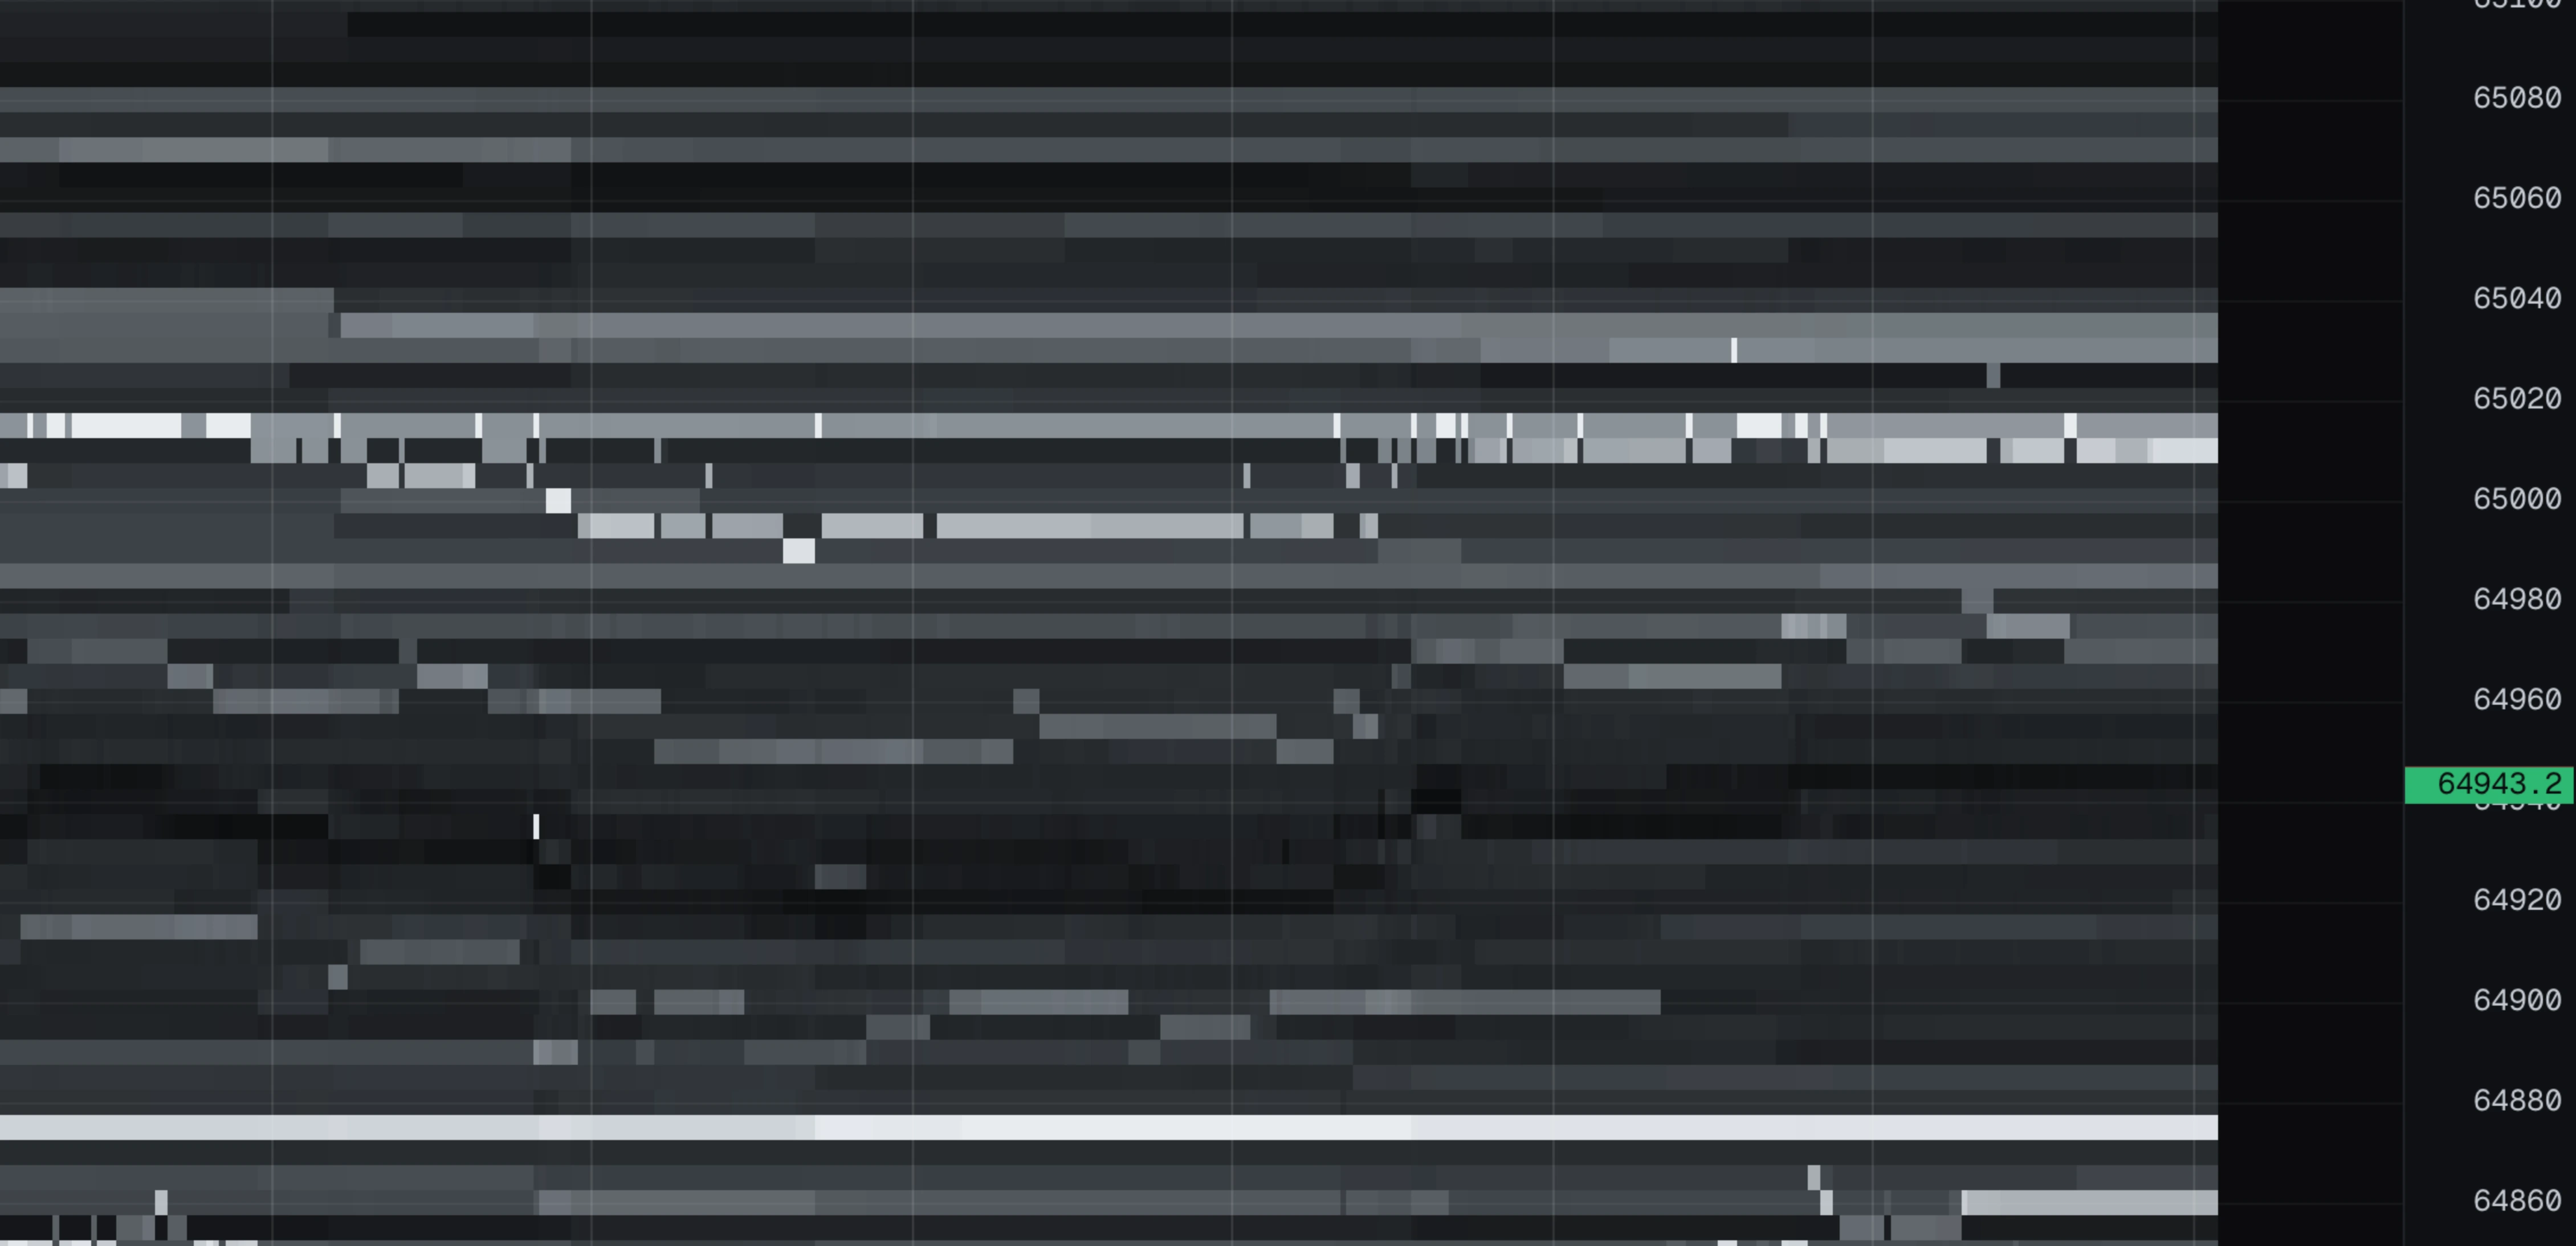
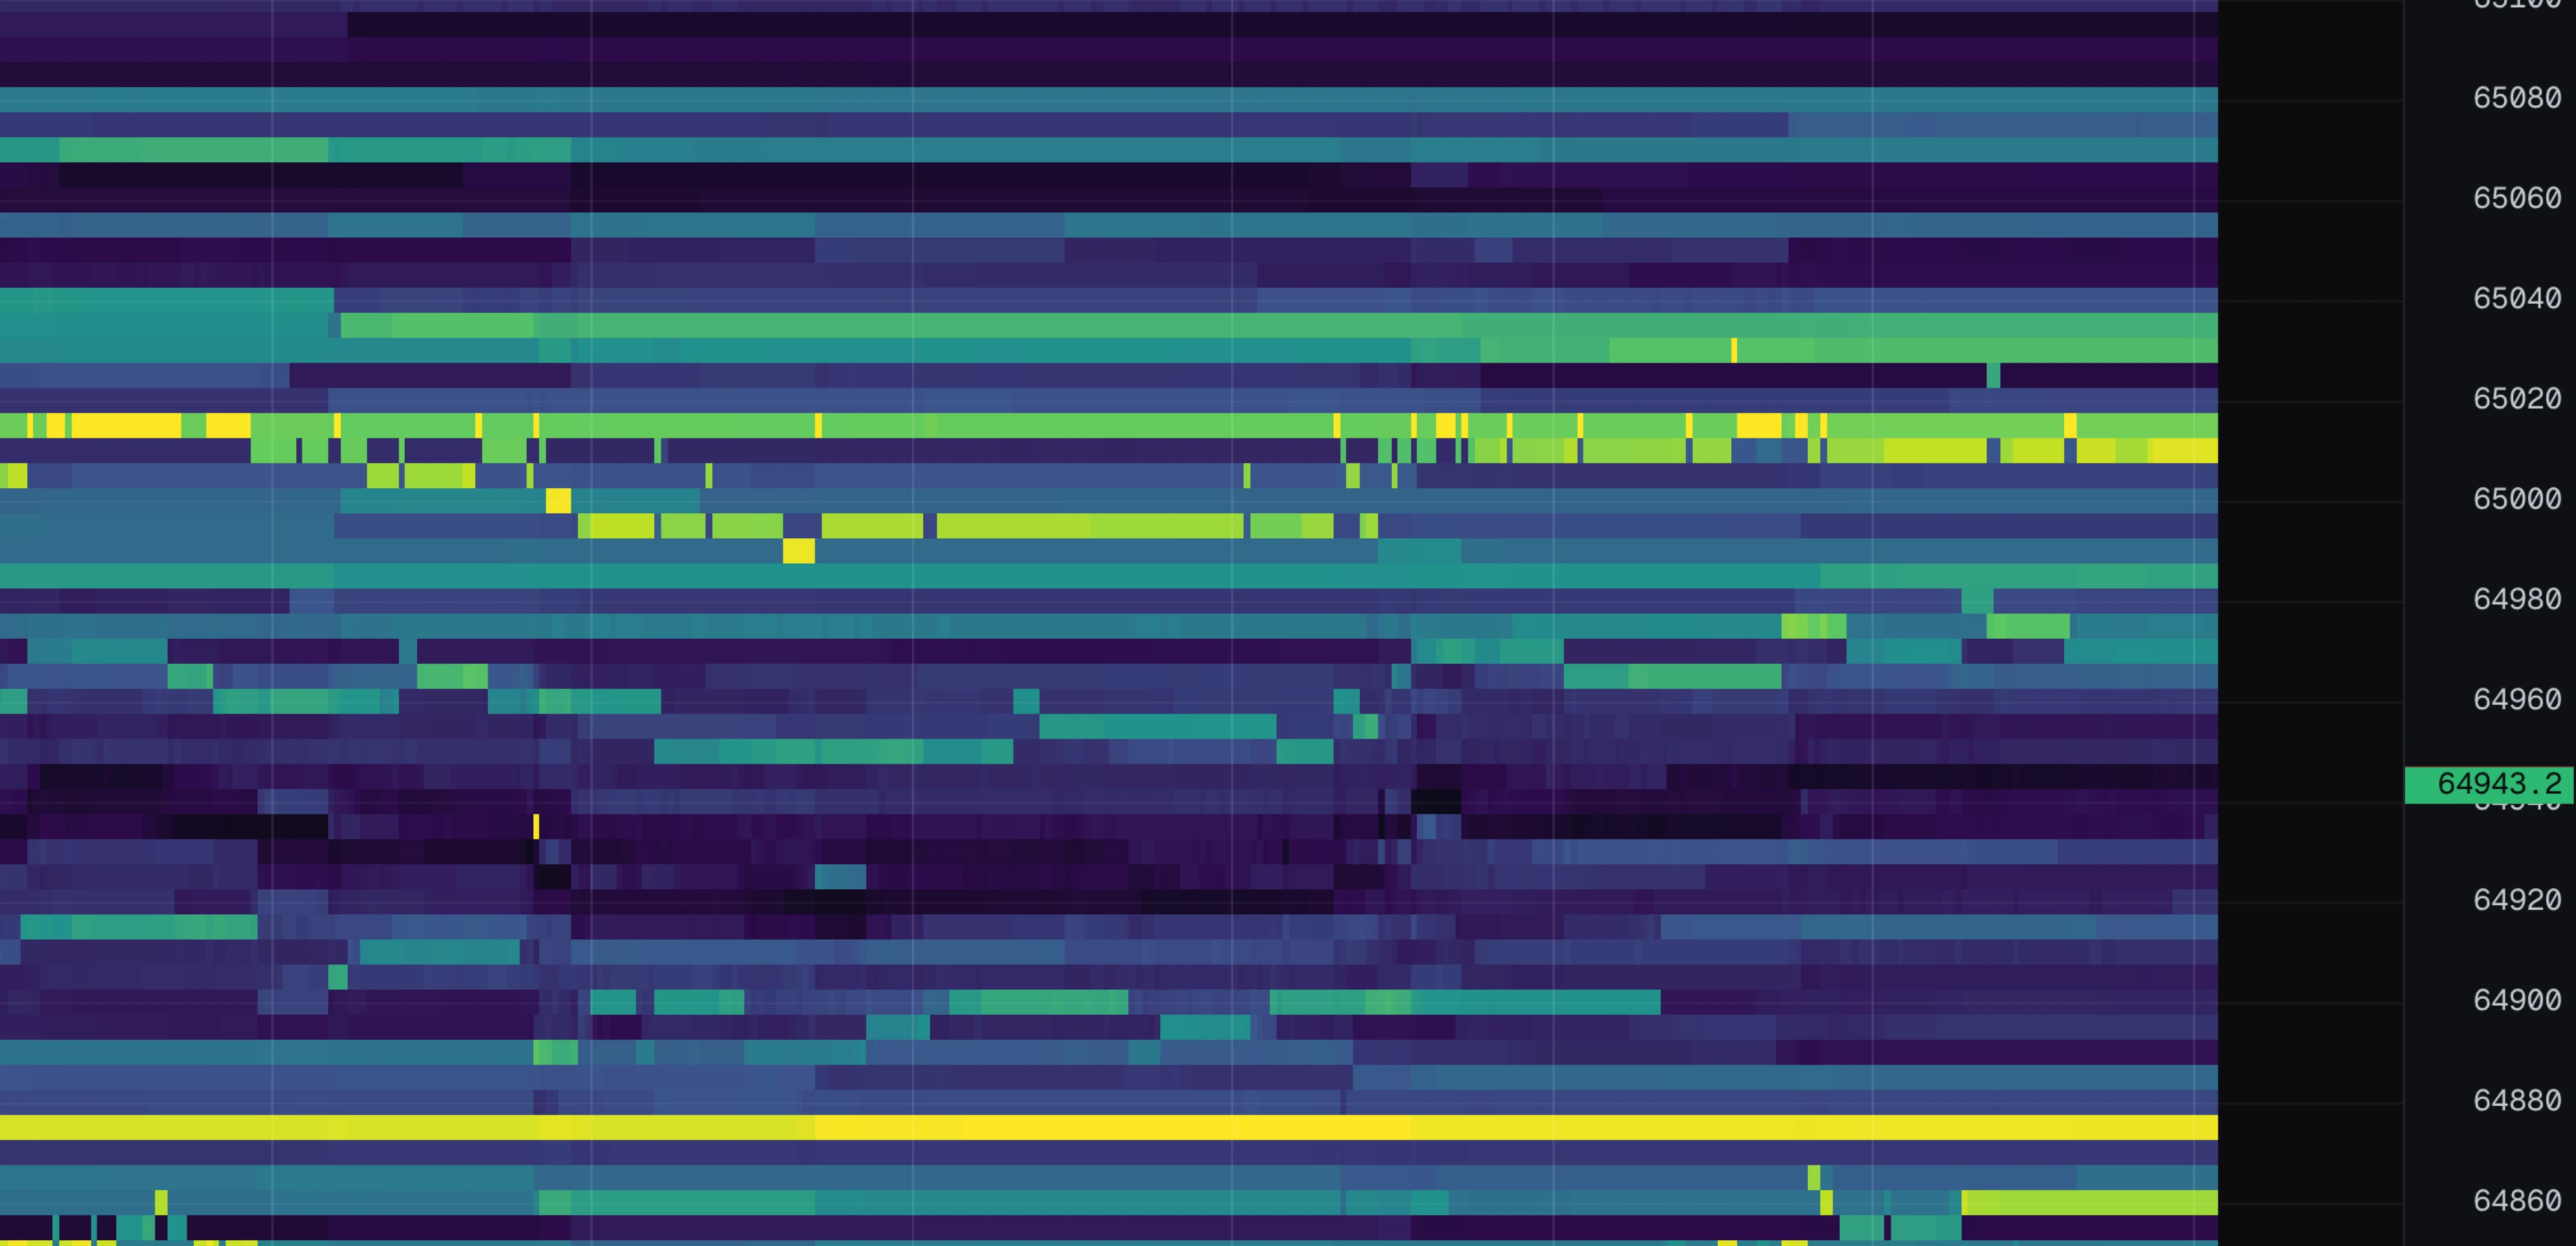
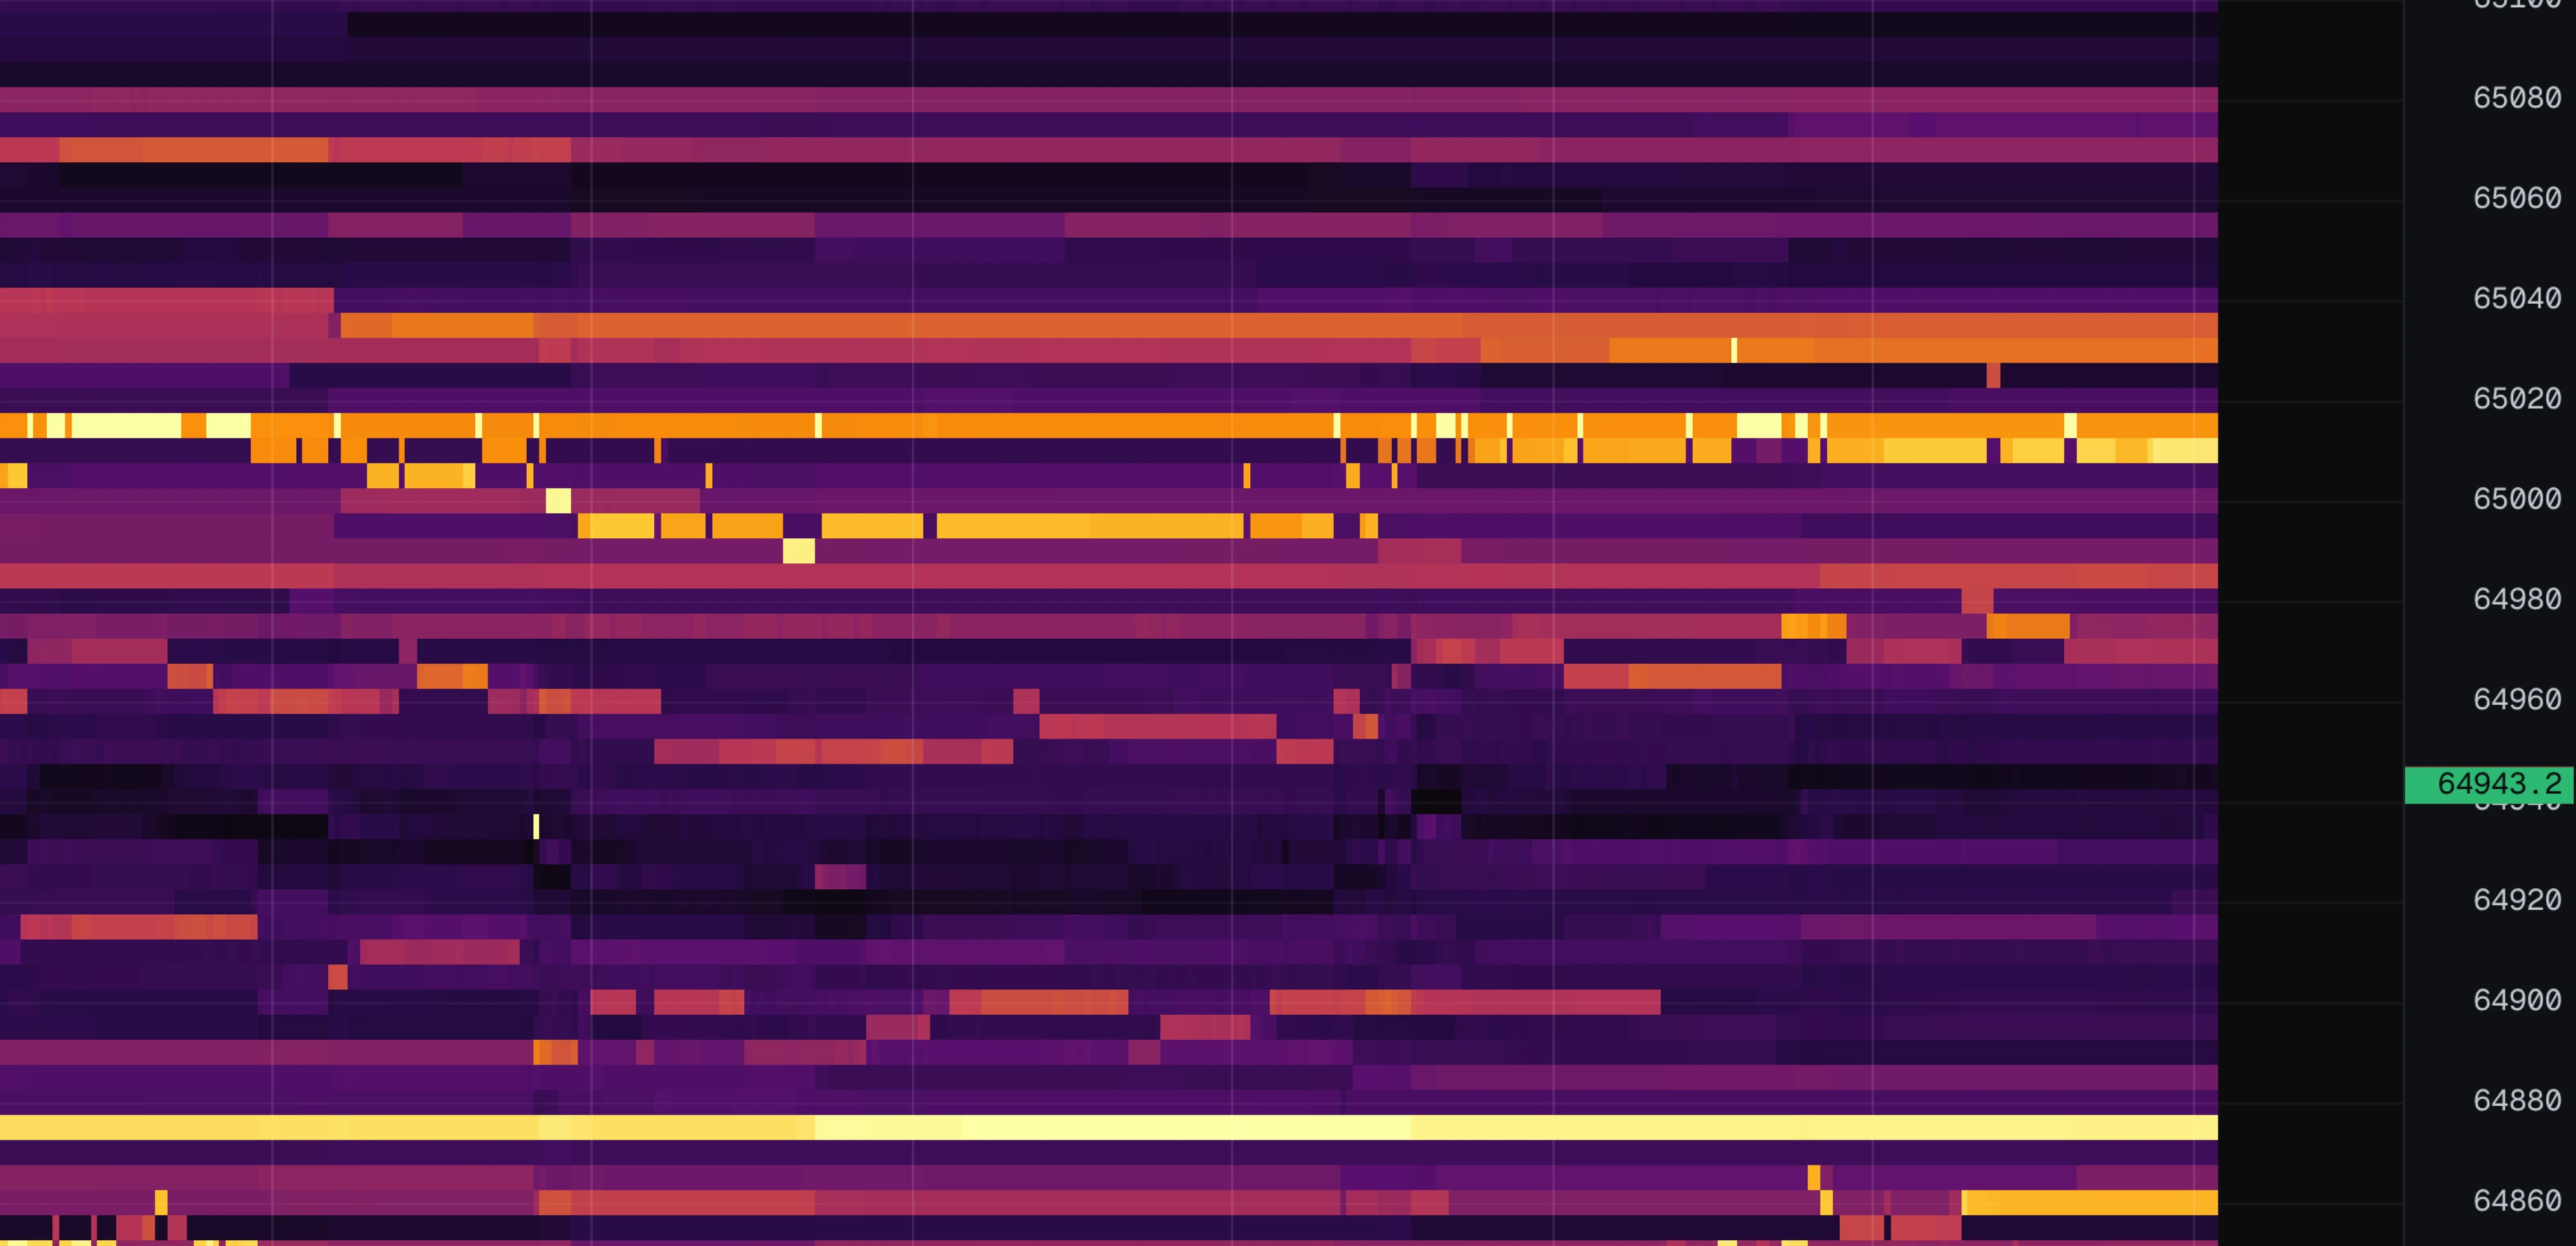
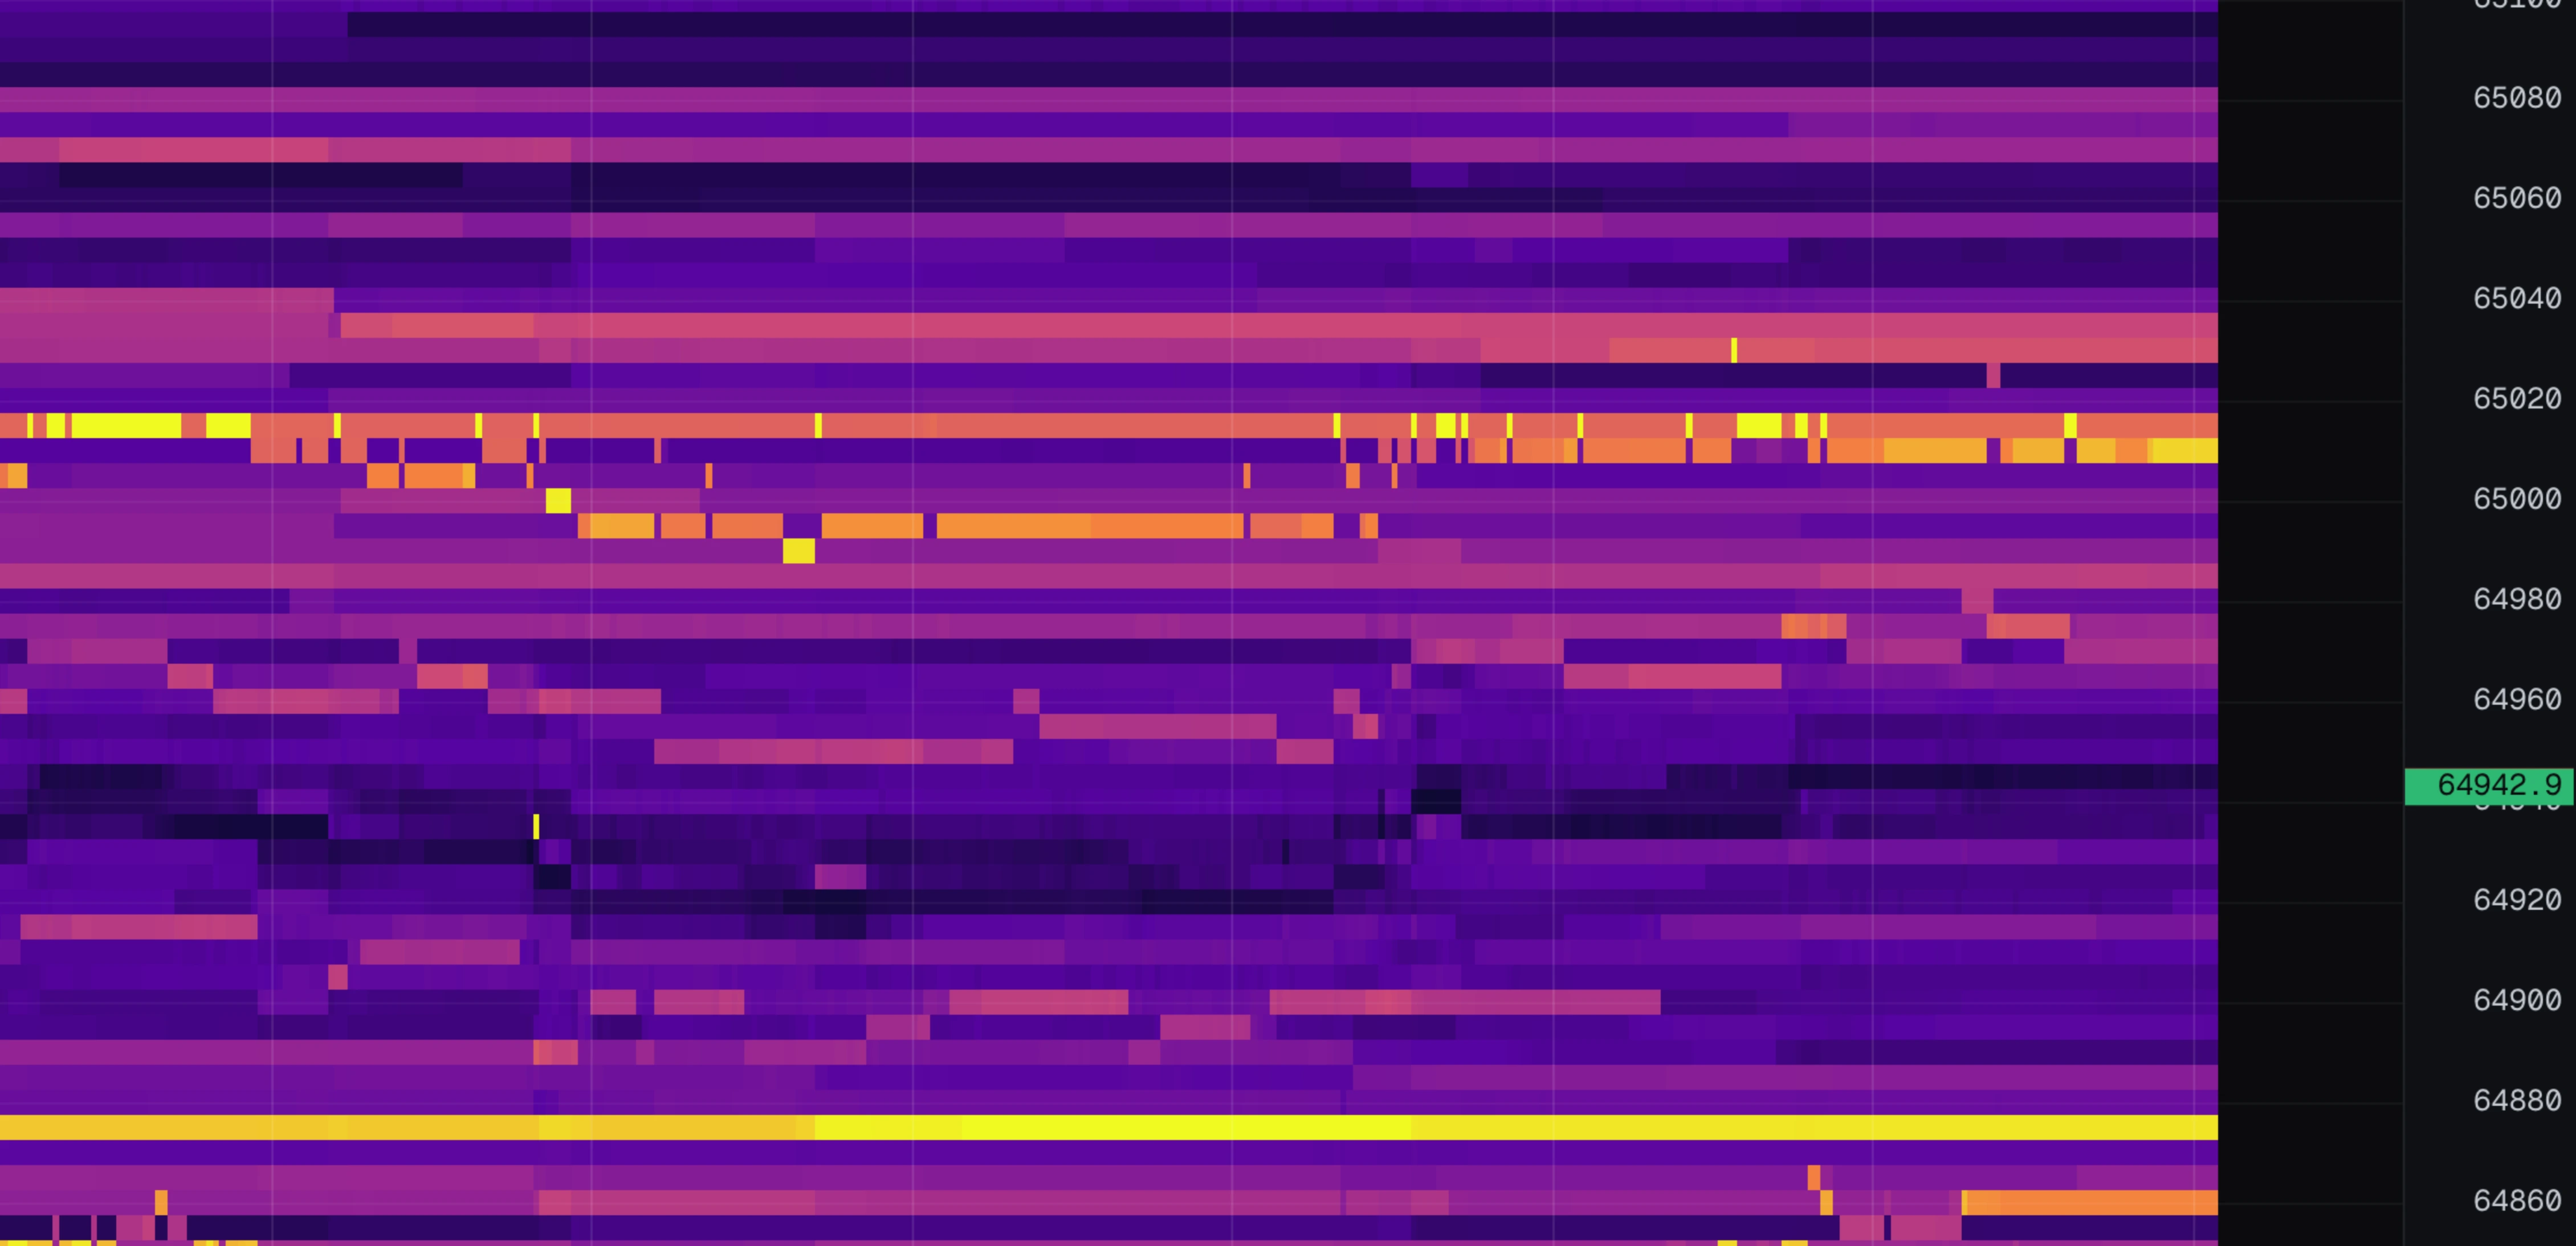
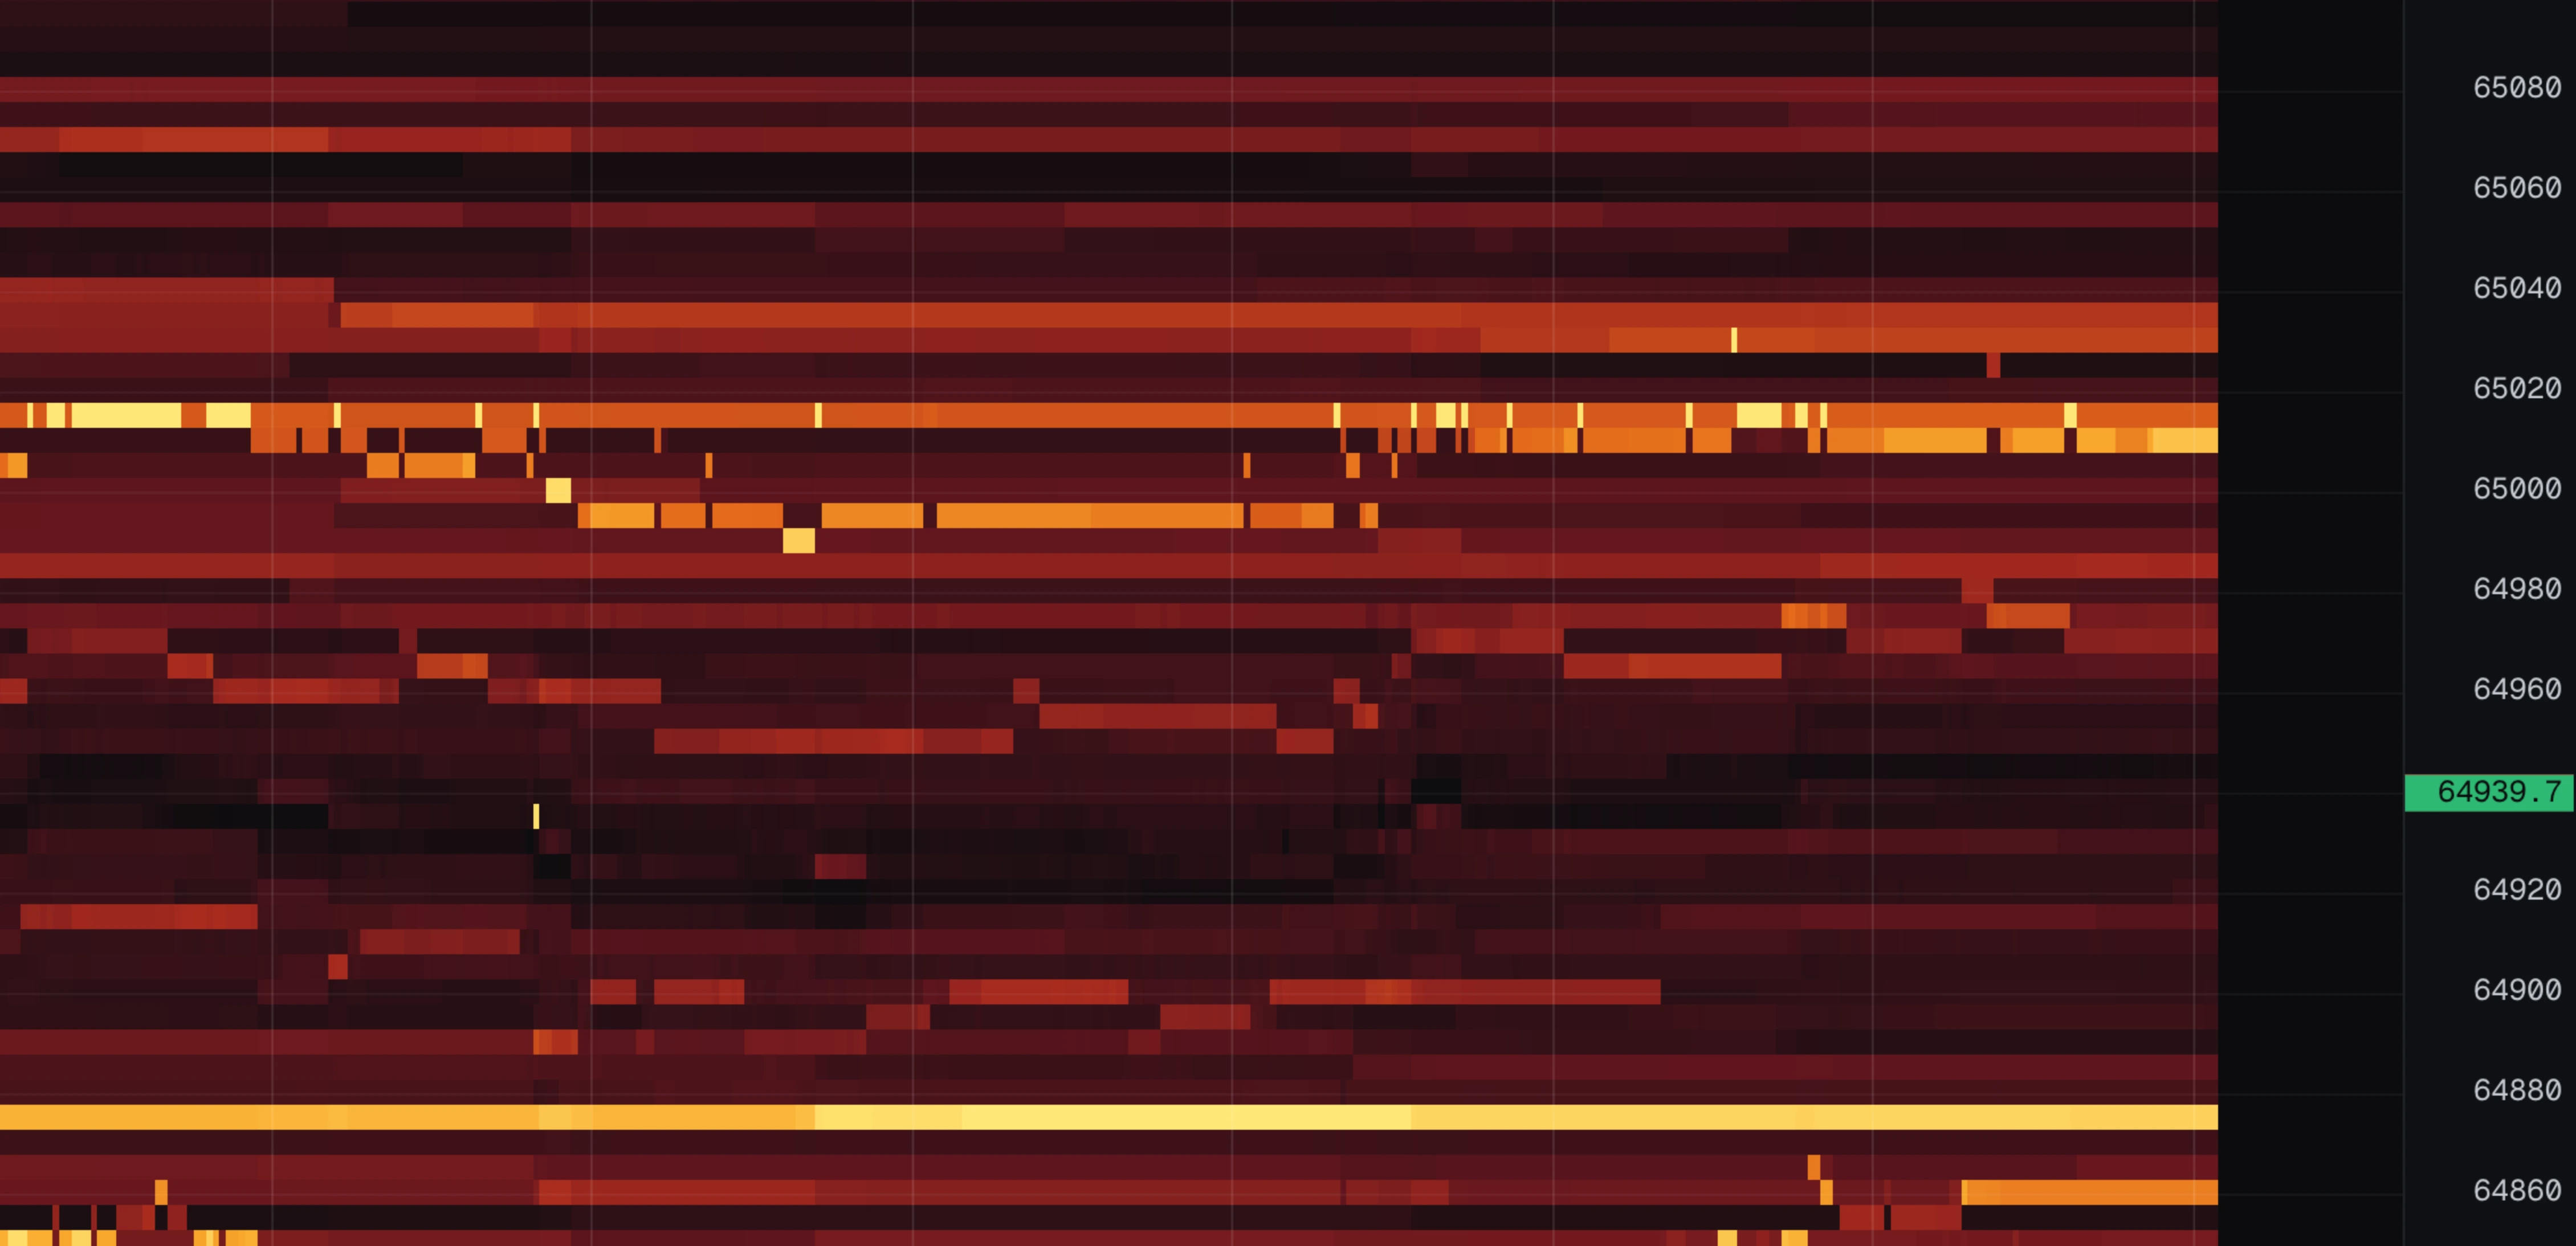
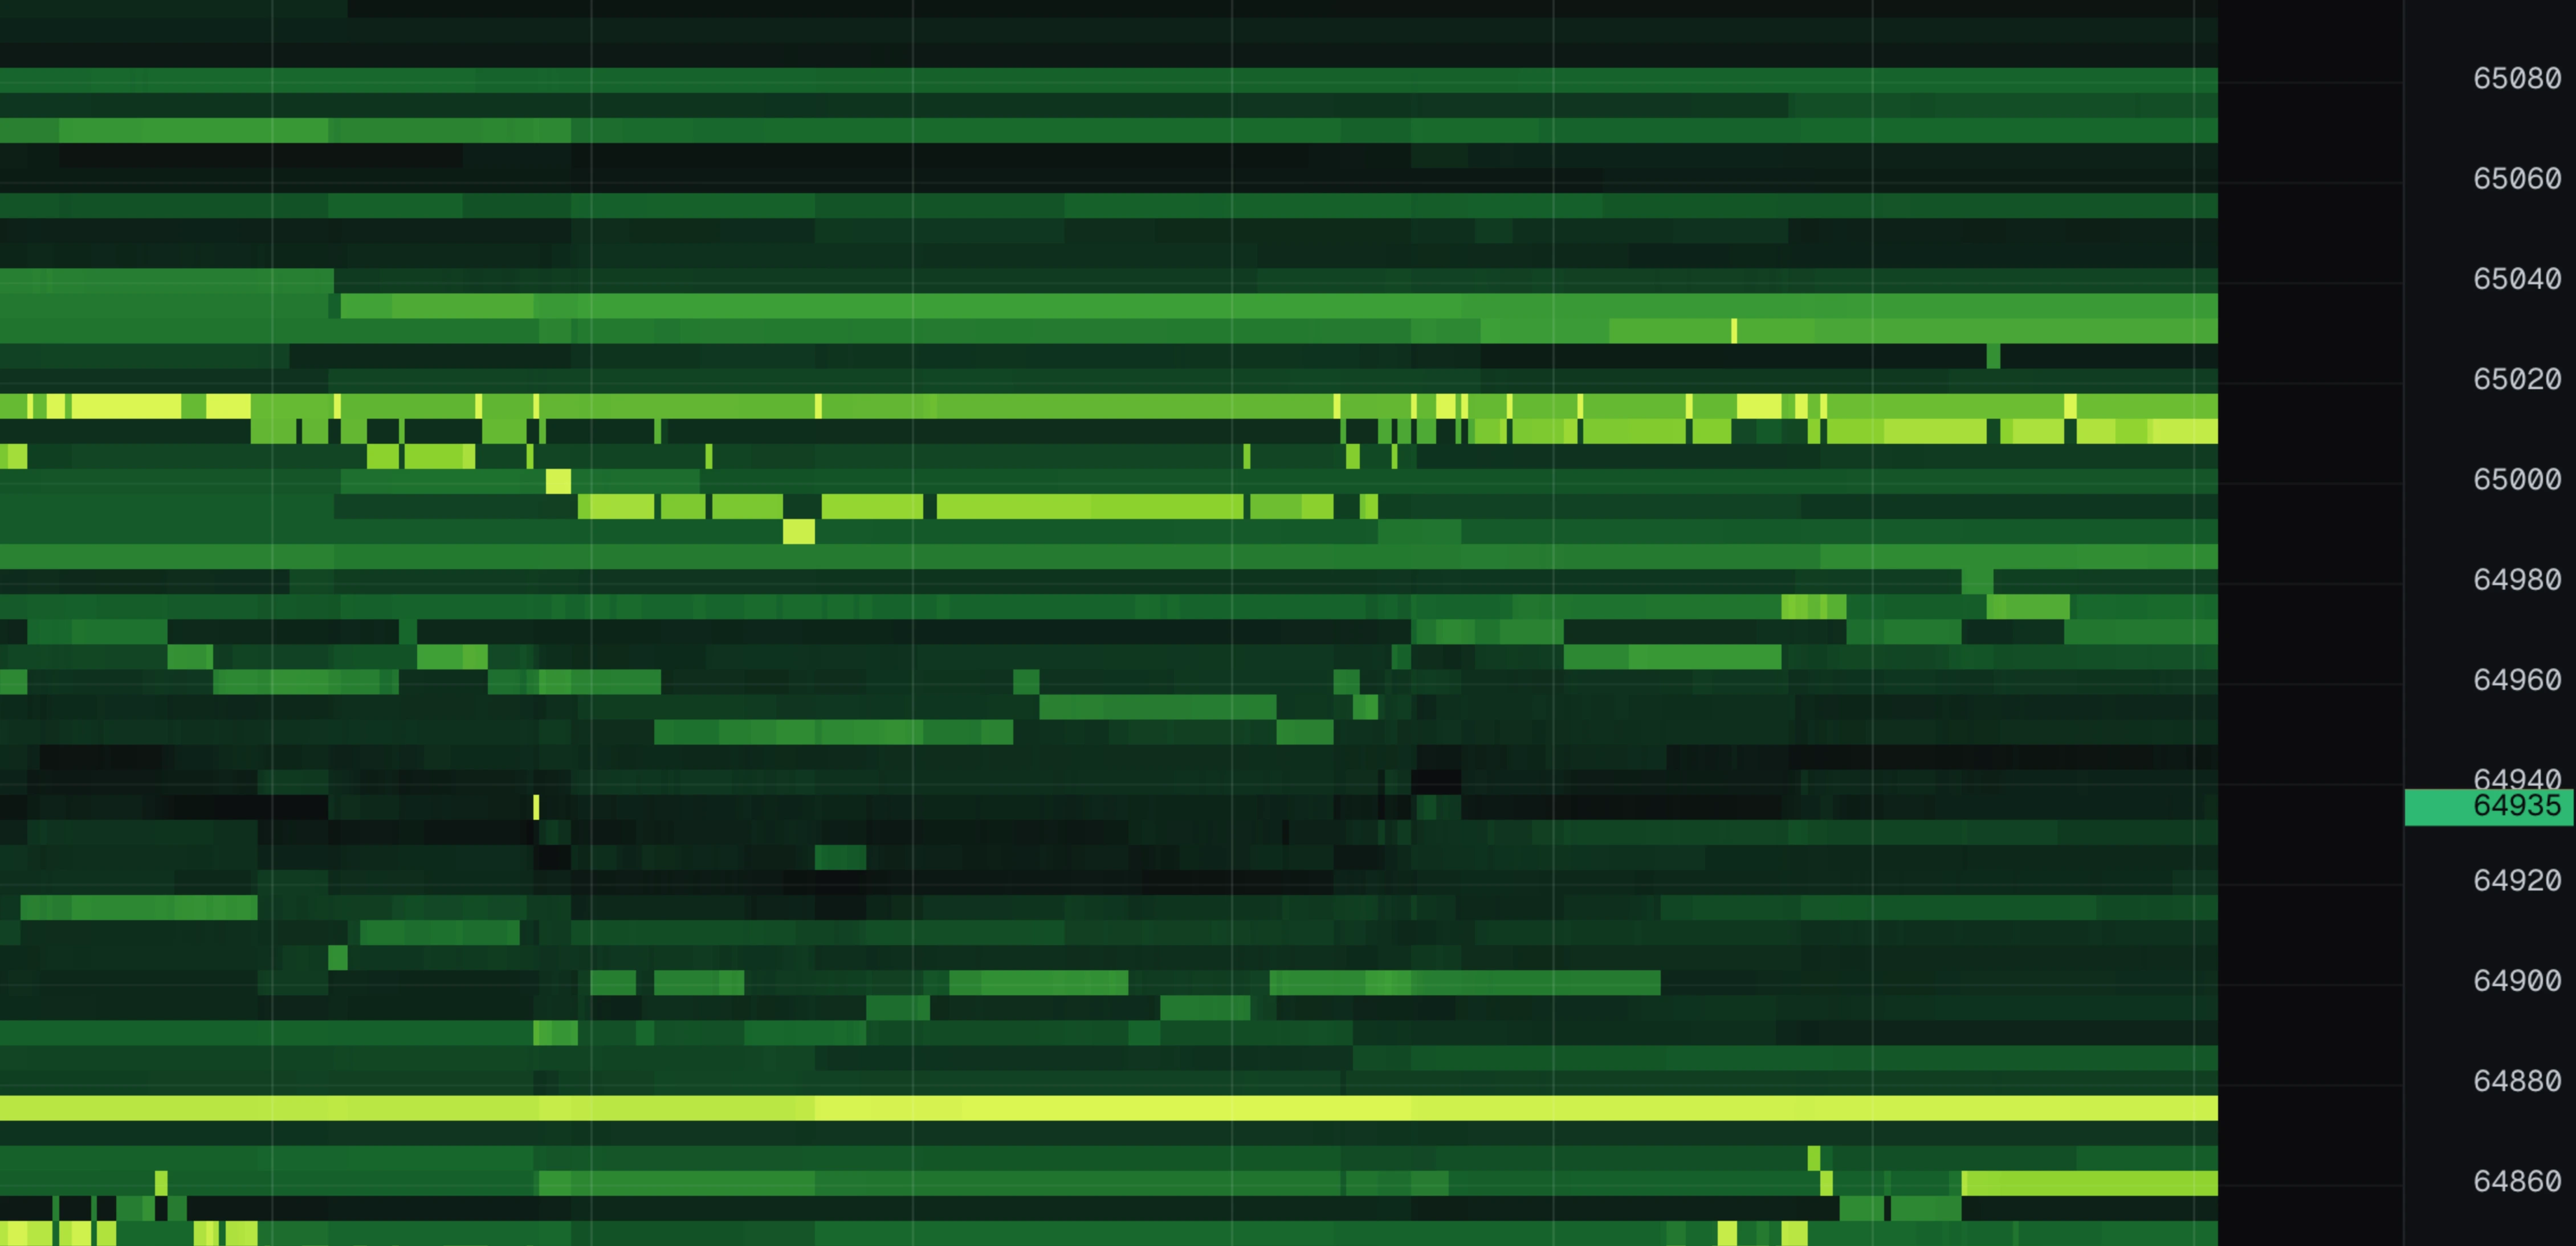
All nine are the same thirty seconds of the same market, so the only difference is the colours.
Price per row, slice, book rows
Three settings decide what the grid shows. In plain terms:
| Setting | Plain meaning |
|---|---|
| price / row | How big a price range one row covers. "5" means every row is $5 of price. |
| slice | How often the book is sampled, in milliseconds. One column per slice. |
| book rows | How far above and below the price the chart has data at all. |
price / row
On auto it picks a sensible value per instrument: about $5 per row for BTC, about $0.20 for ETH. Finer rows sound better but are worse: the same order gets smeared across several rows, stops reading as one solid band, and flickers. Leave it on auto unless you have a specific reason.
Changing it clears the chart and rebuilds, because the data is stored per row size.
slice
100 ms means the book is sampled ten times a second. Smaller slices catch orders that appear and vanish within a second; larger slices compress time and keep more history. This is not about smoothness — the chart always scrolls at your screen's refresh rate. It is about detail.
book rows
How many rows above and below the price the feed publishes. 400 rows at $5 each covers $2,000 of price in each direction. Zoom out past that and you are looking at empty space — raise book rows or zoom back in.

The touch line and volume dots
Two overlays carry the actual trading. Both are on by default.
touch
The best bid (green) and best ask (red) drawn as two lines through time. These are the prices people are currently buying at and selling at, and the gap between the lines is the spread. Everything else on the chart is read relative to these lines: trades happen at them, absorption happens at them, and a wall only matters by how far from them it sits.
dots
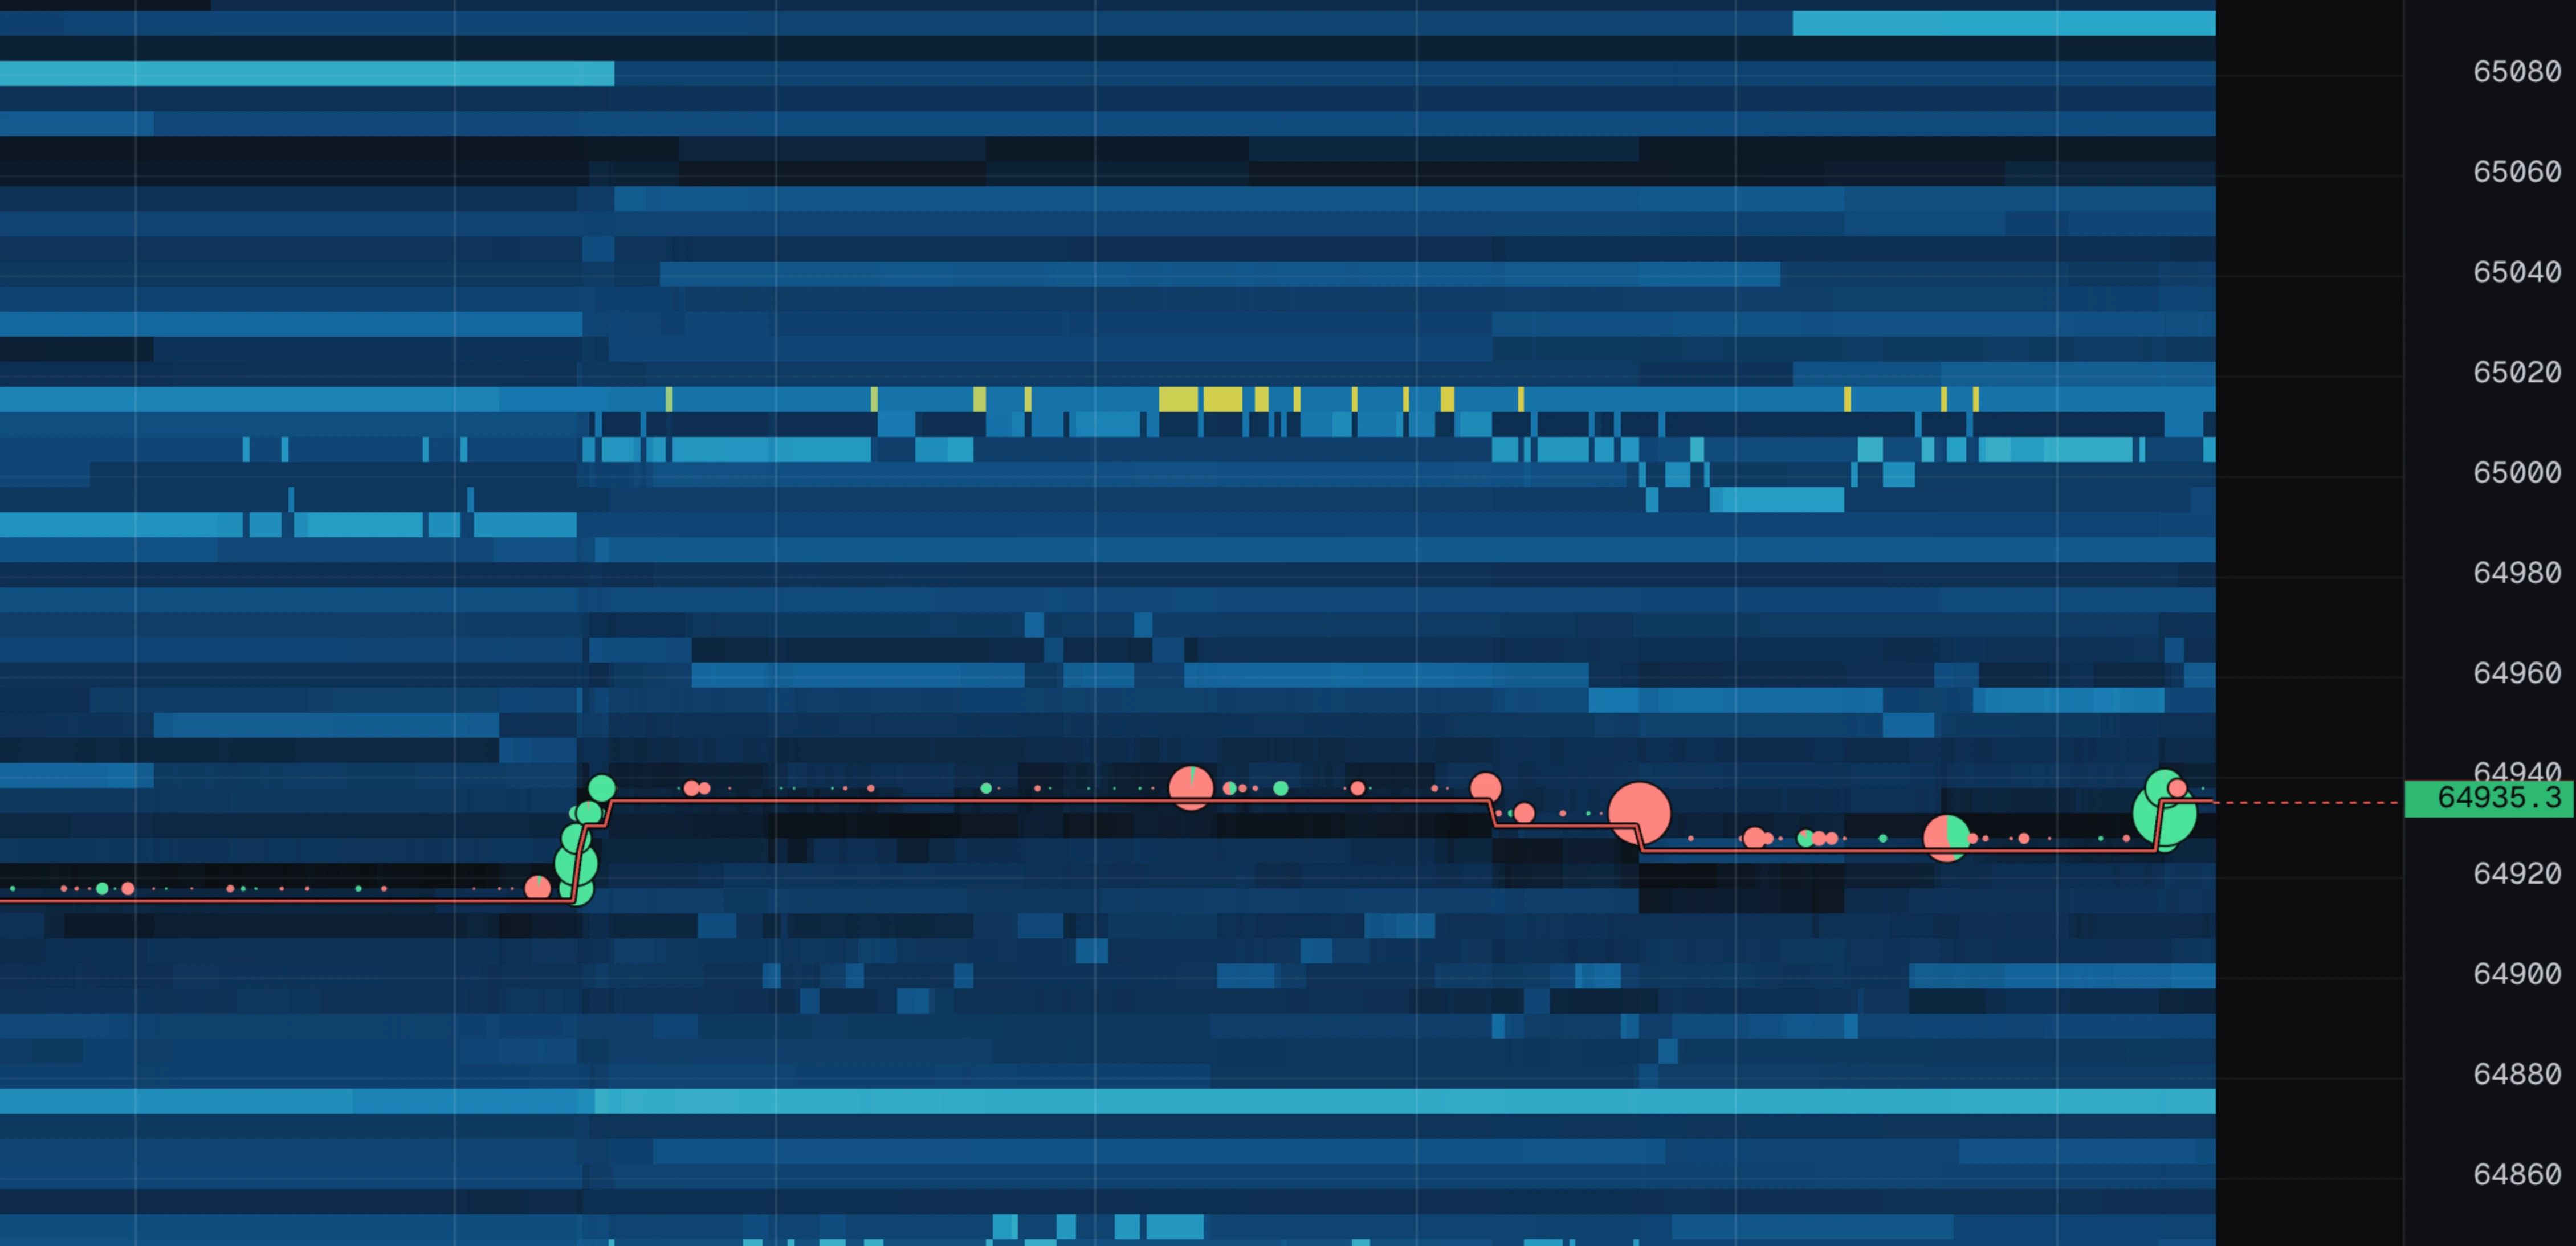
Every trade draws as a circle at the price it traded. The rules:
- Green = an aggressive buy (someone paid the ask). Red = an aggressive sell (someone hit the bid).
- Bigger circle = more volume.
- On large circles, the green wedge shows what share was buys.
Trades happen right at the touch lines, so dots cluster around them — that is normal and expected.
Footprint
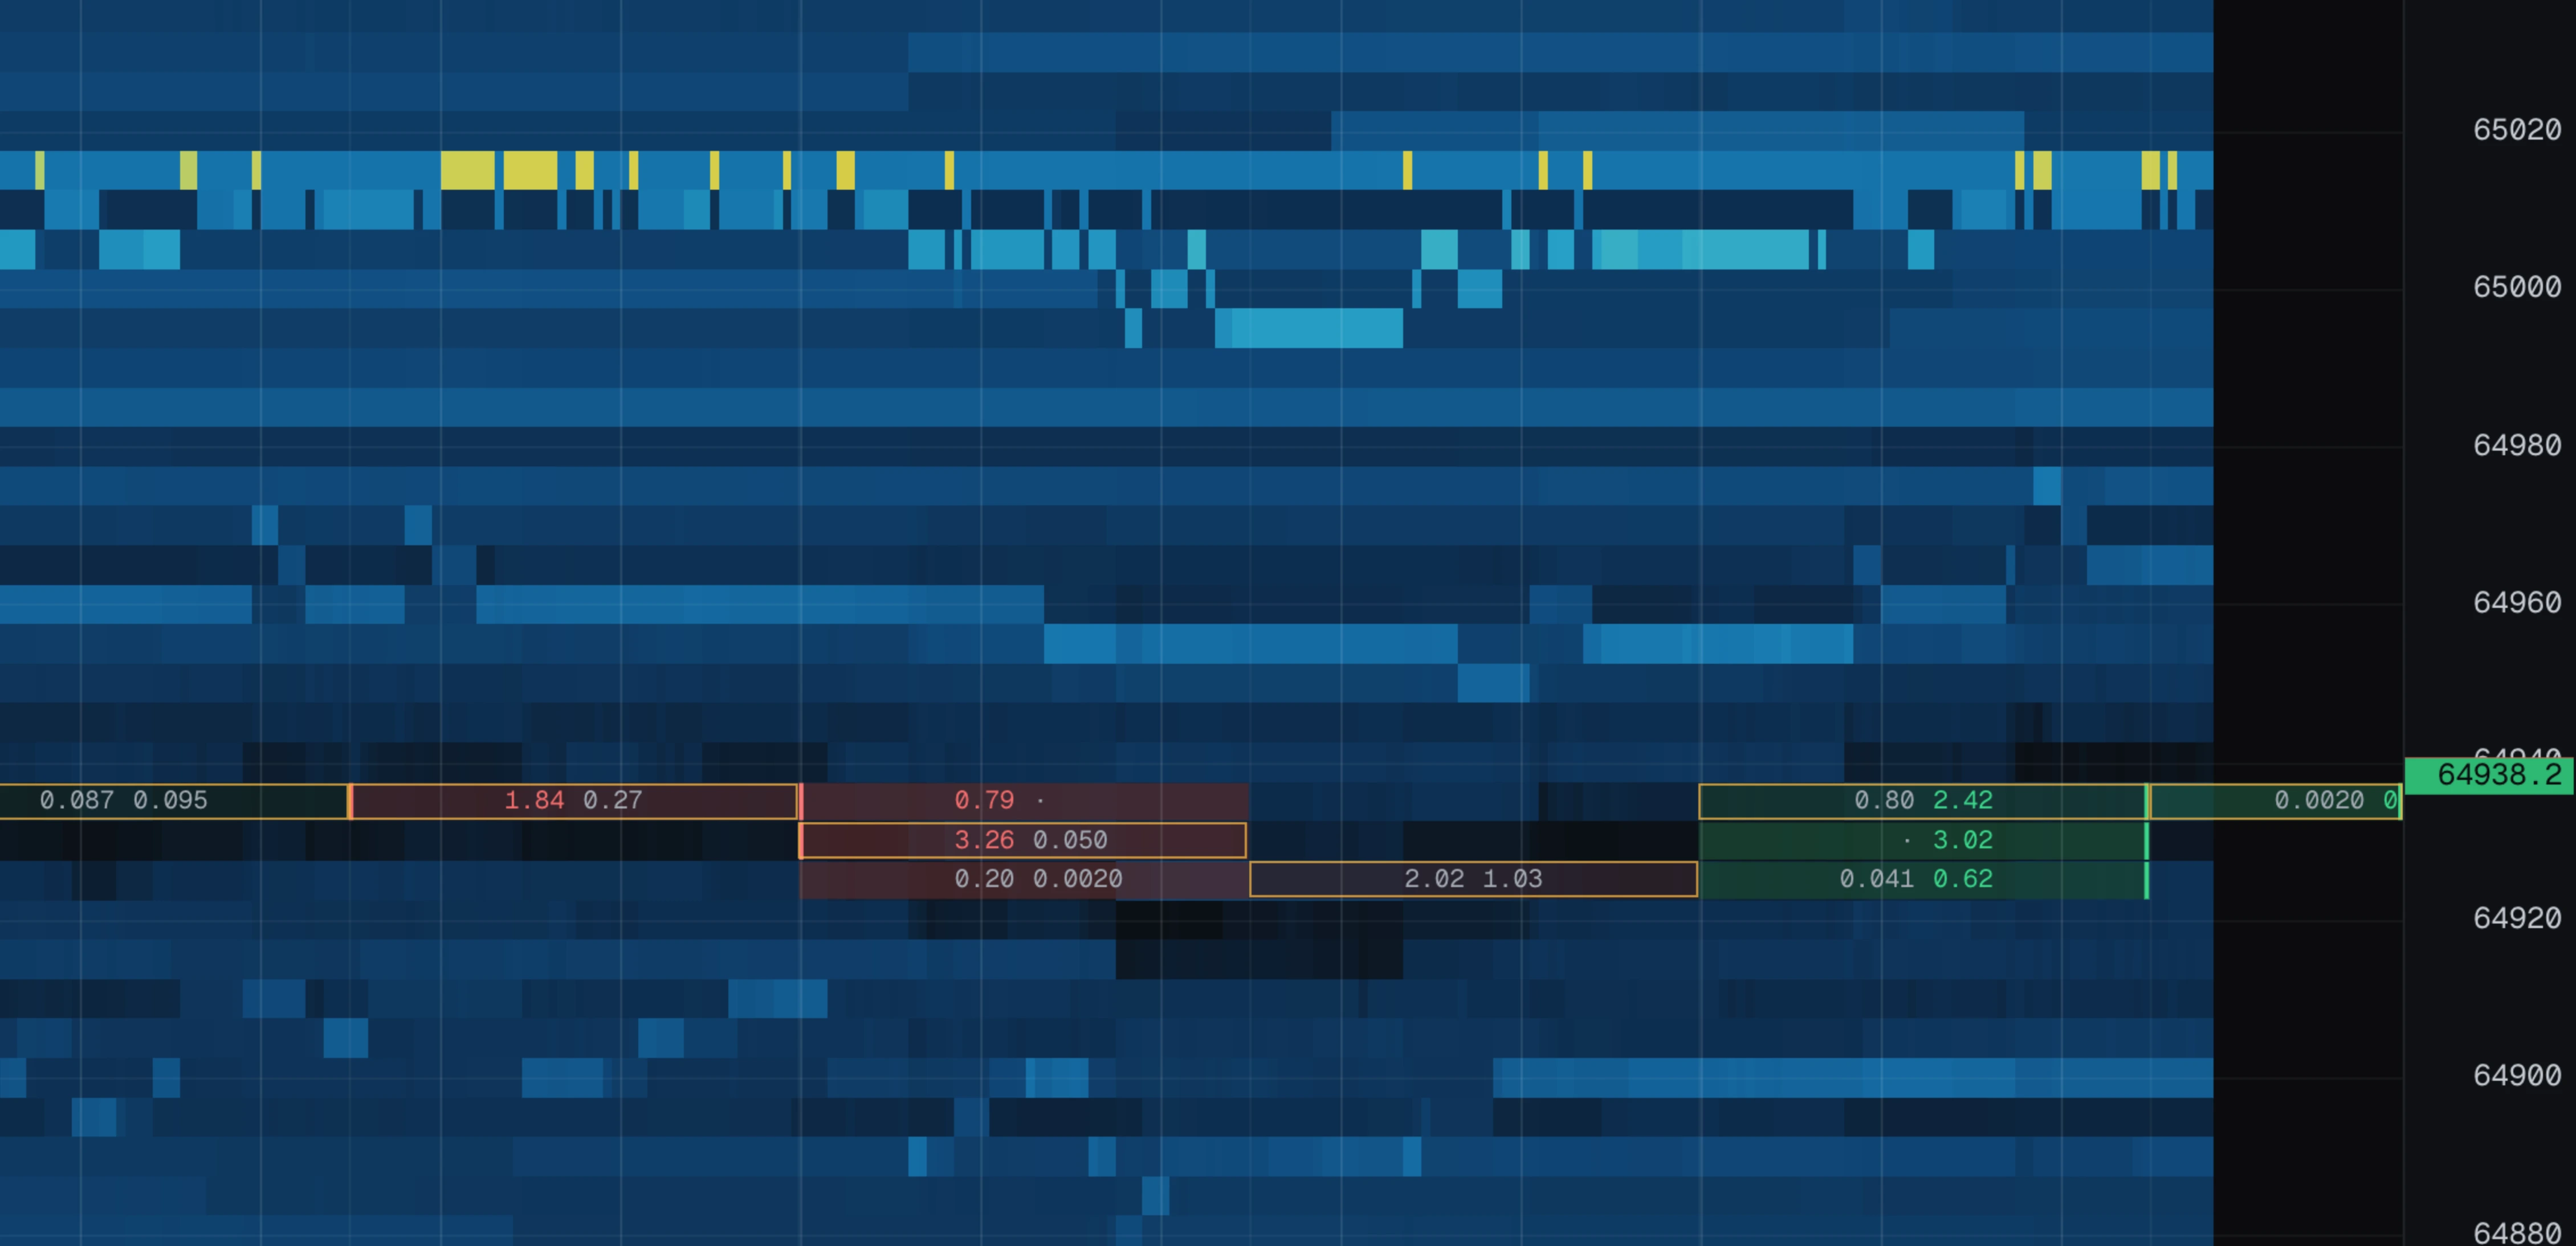
fp writes the numbers behind the dots into the chart: at every price that traded, how much was sold into the bid on the left and how much was bought from the ask on the right. A dot says business happened here and roughly how much; the footprint says which side did it.
- A dot (·) on one side means nothing traded there at all — the cell is one sided.
- A coloured bar down the edge of a cell marks an imbalance: one side at least three times the other, on a cell big enough for that to mean something.
- The yellow outline is the bar's own point of control, the price that carried the most volume in that bar.
Cells are bars, not slices. A 100 ms column is a few pixels wide and holds a handful of prints, so columns are folded into bars wide enough for the numbers to fit, and the bar length follows your zoom. Pin a length with candles and the footprint adopts it, so the numbers line up with the bars.
The live book column
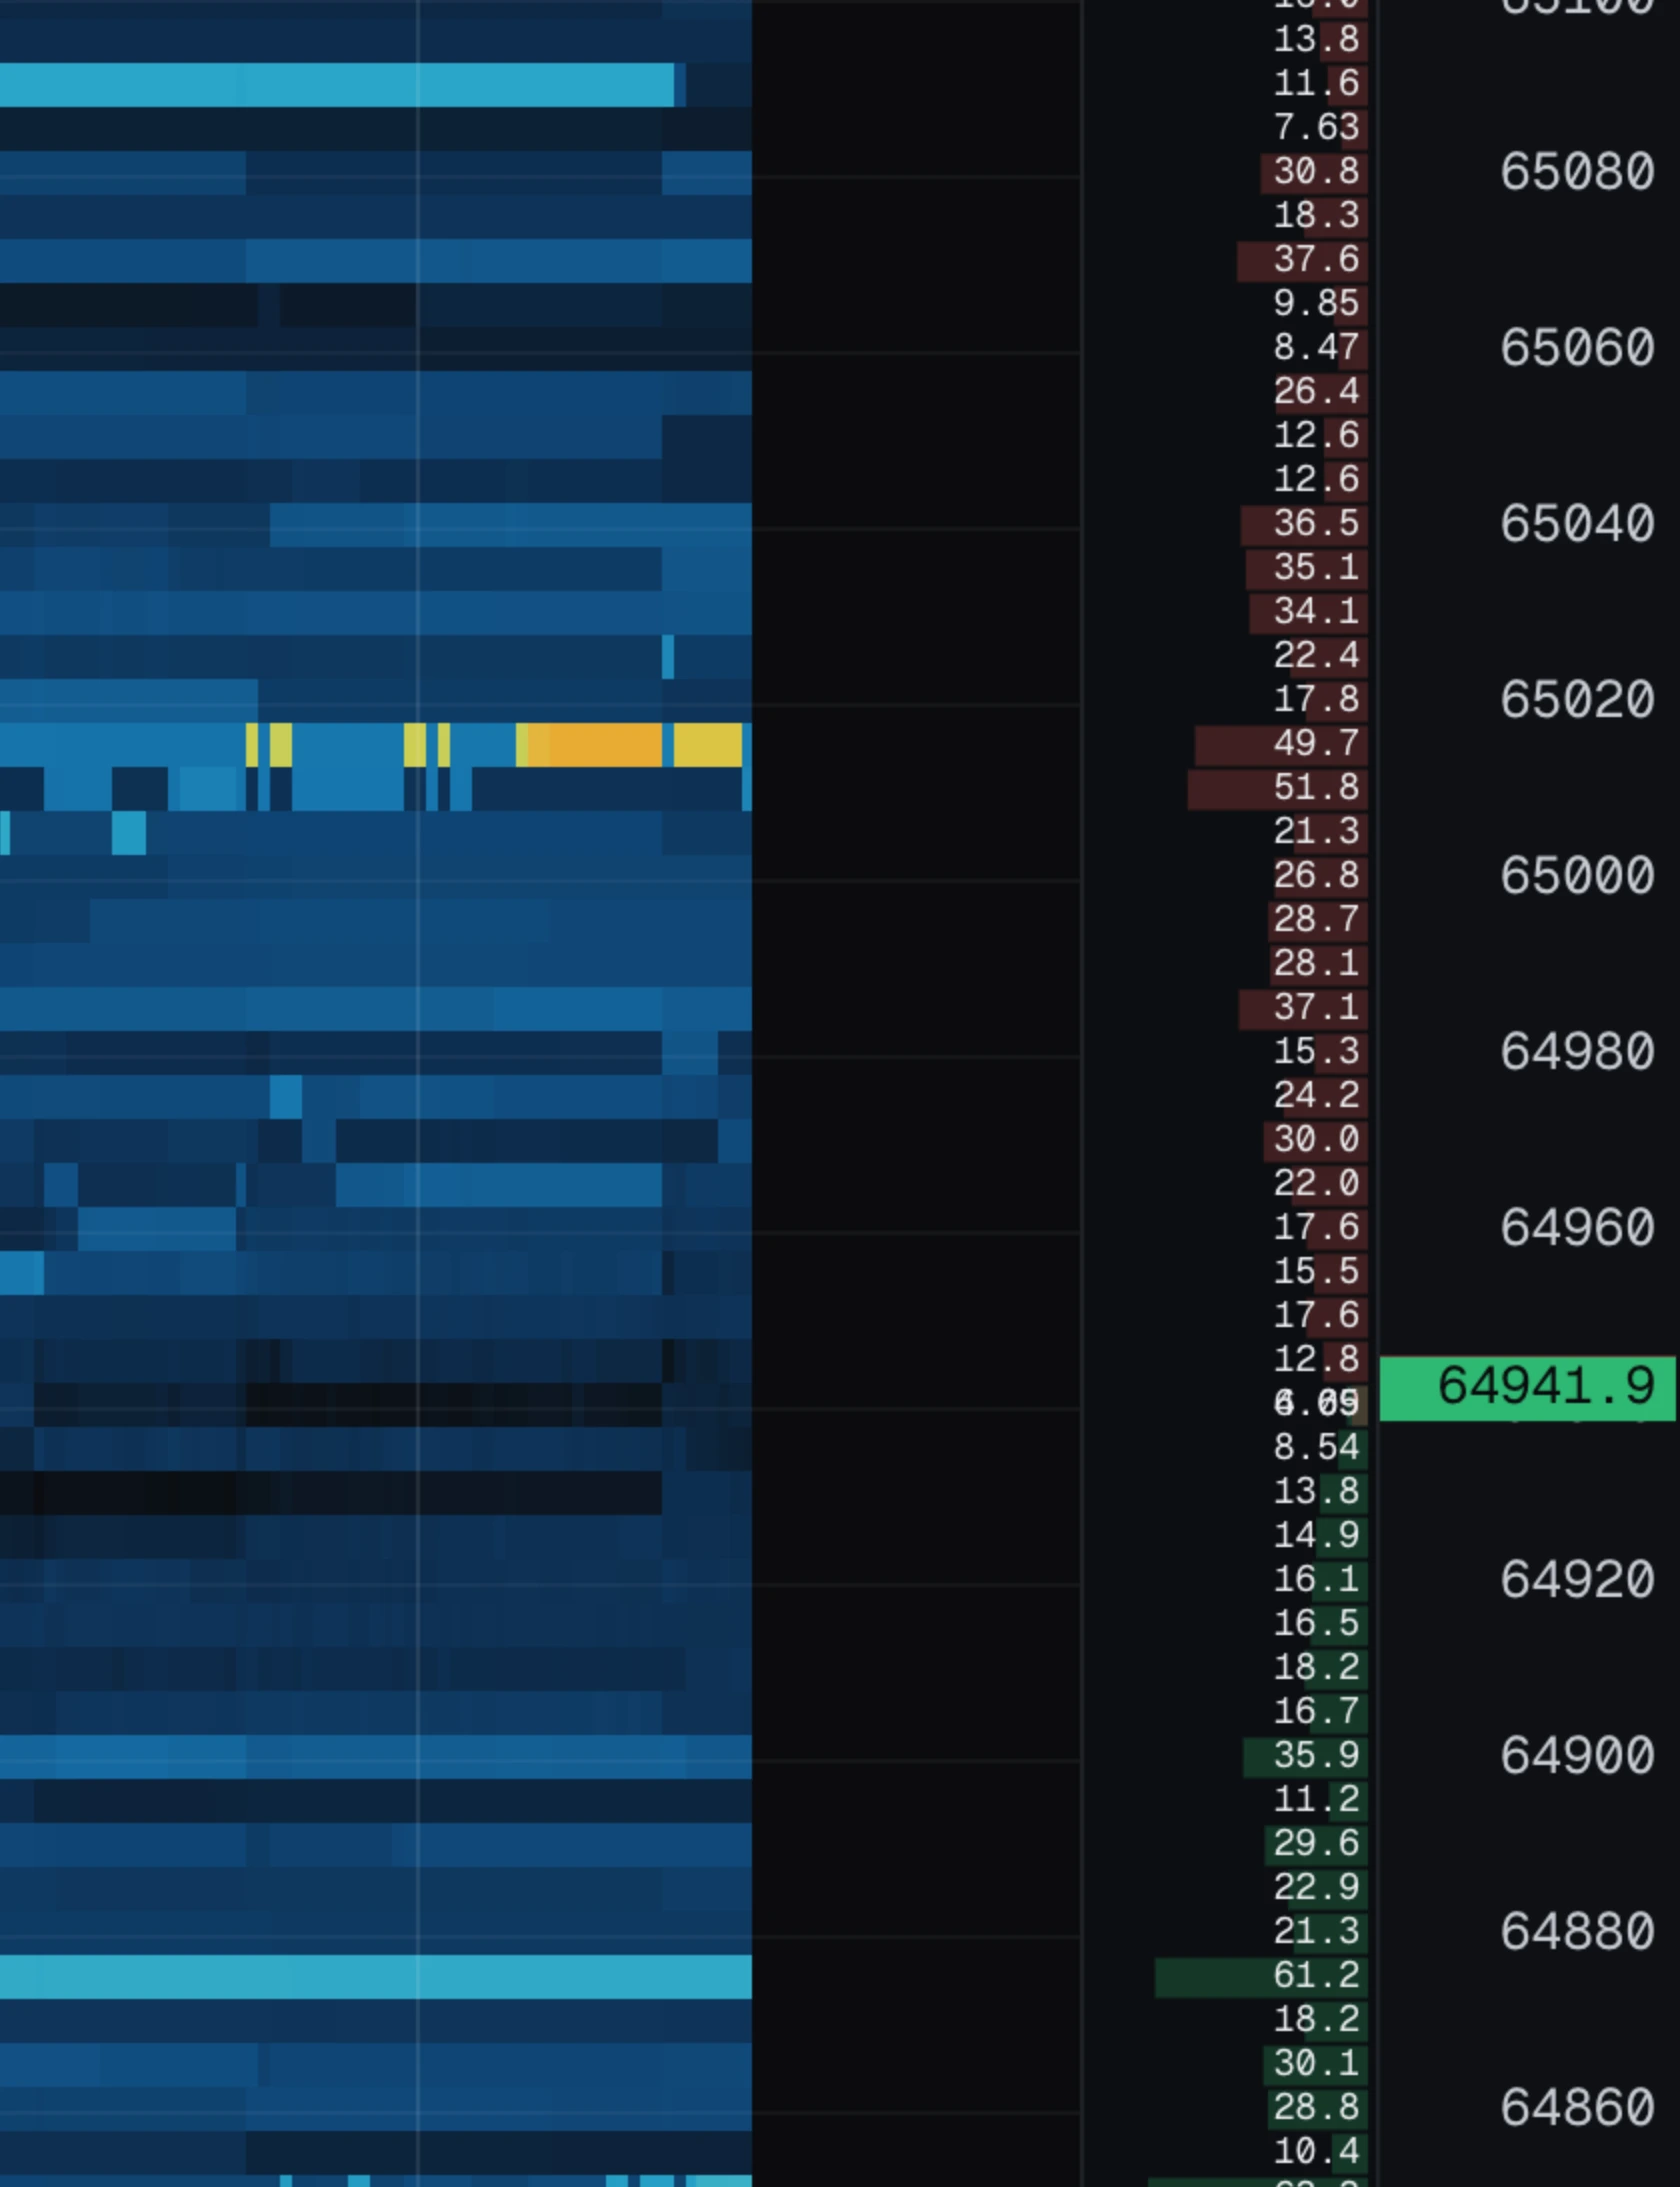
cob shows the order book right now, as two bar charts attached to the right edge of the chart: bids above the touch, asks below. The heatmap is history; this is the present.
A long bar = a big order waiting. The size is printed inside the bar when there is room.
The real value is comparing it with the heatmap behind it: a long bright streak with a still-long bar means the order is still there; the same streak with an empty bar means it just left, and the liquidity panel will say whether it was cancelled or eaten.
Candles
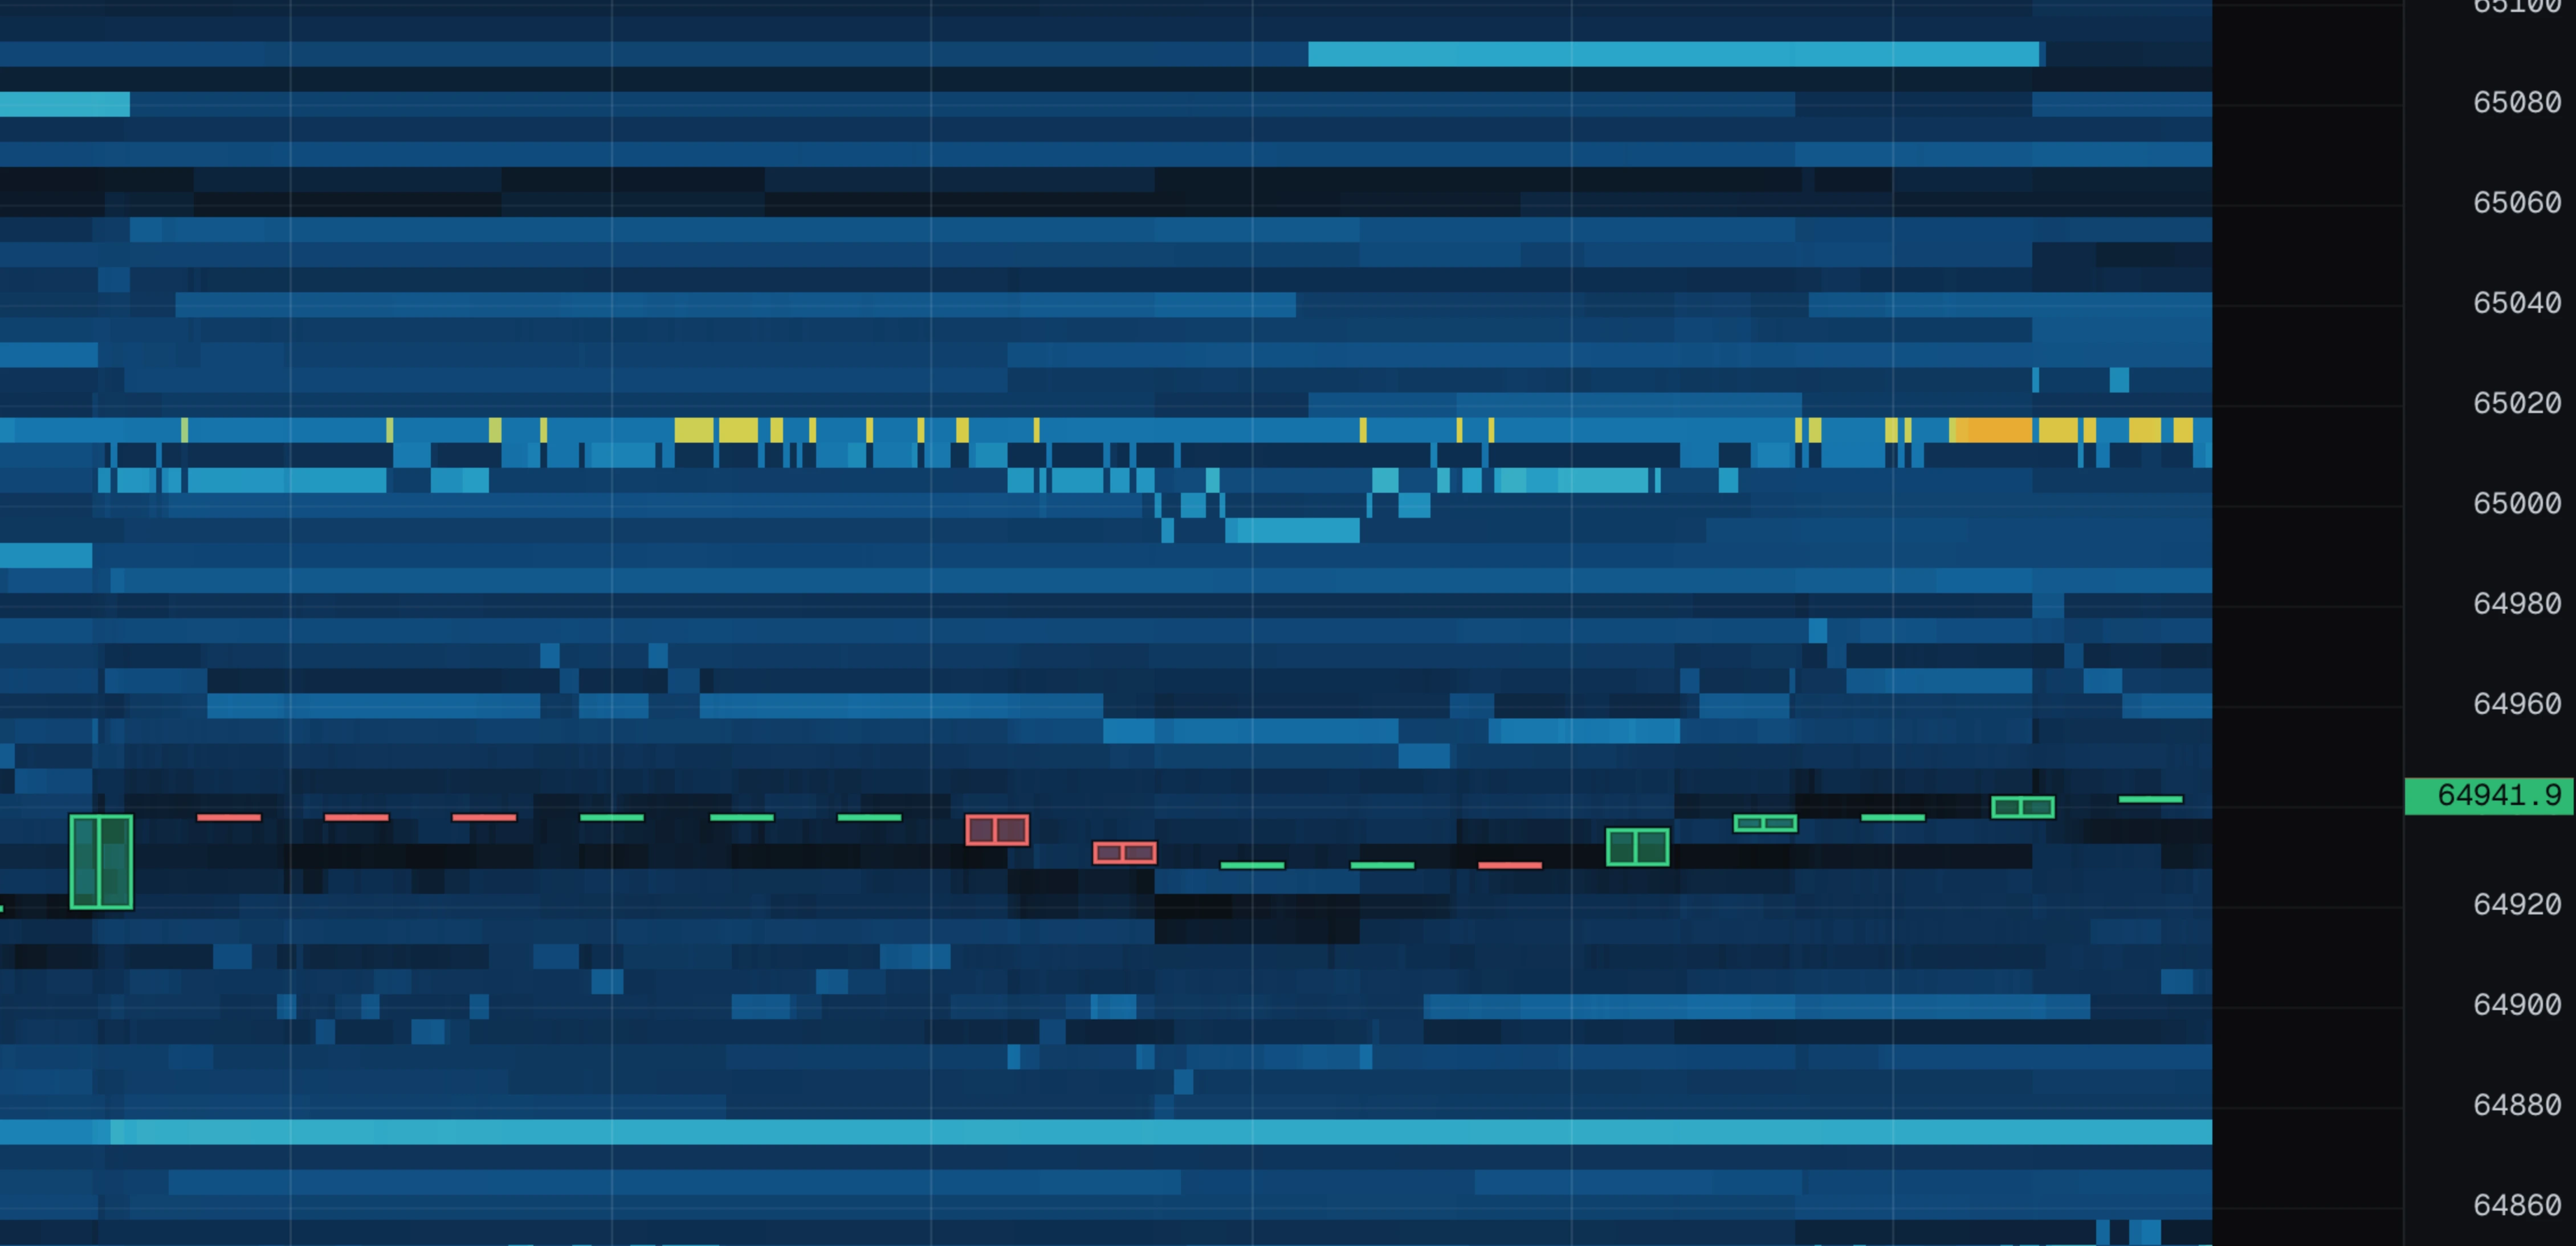
candles draws normal OHLC price candles on top of the heatmap. They are drawn as outlines rather than solid blocks on purpose, so you can still see the liquidity underneath.
The candle length follows your zoom automatically, so candles stay a readable size however far in or out you are. If you want to pin the length, turn candles on and a bar selector appears: auto, 5s, 15s, 1m, 5m.

VWAP and its band
vwap is the average price that all trading this session happened at, weighted by size. Drawn as a purple line, with a band one standard deviation above and below.
How to read it:
- Price above the line = the market is paying above the session average.
- A wide band = trading has been spread out. A tight band = trading has been pinned to one price.
- Price returning into the band after hanging outside = that push is over.
It starts counting when you open the page or change symbol, and it never rolls off — it is a session average, not a moving one.
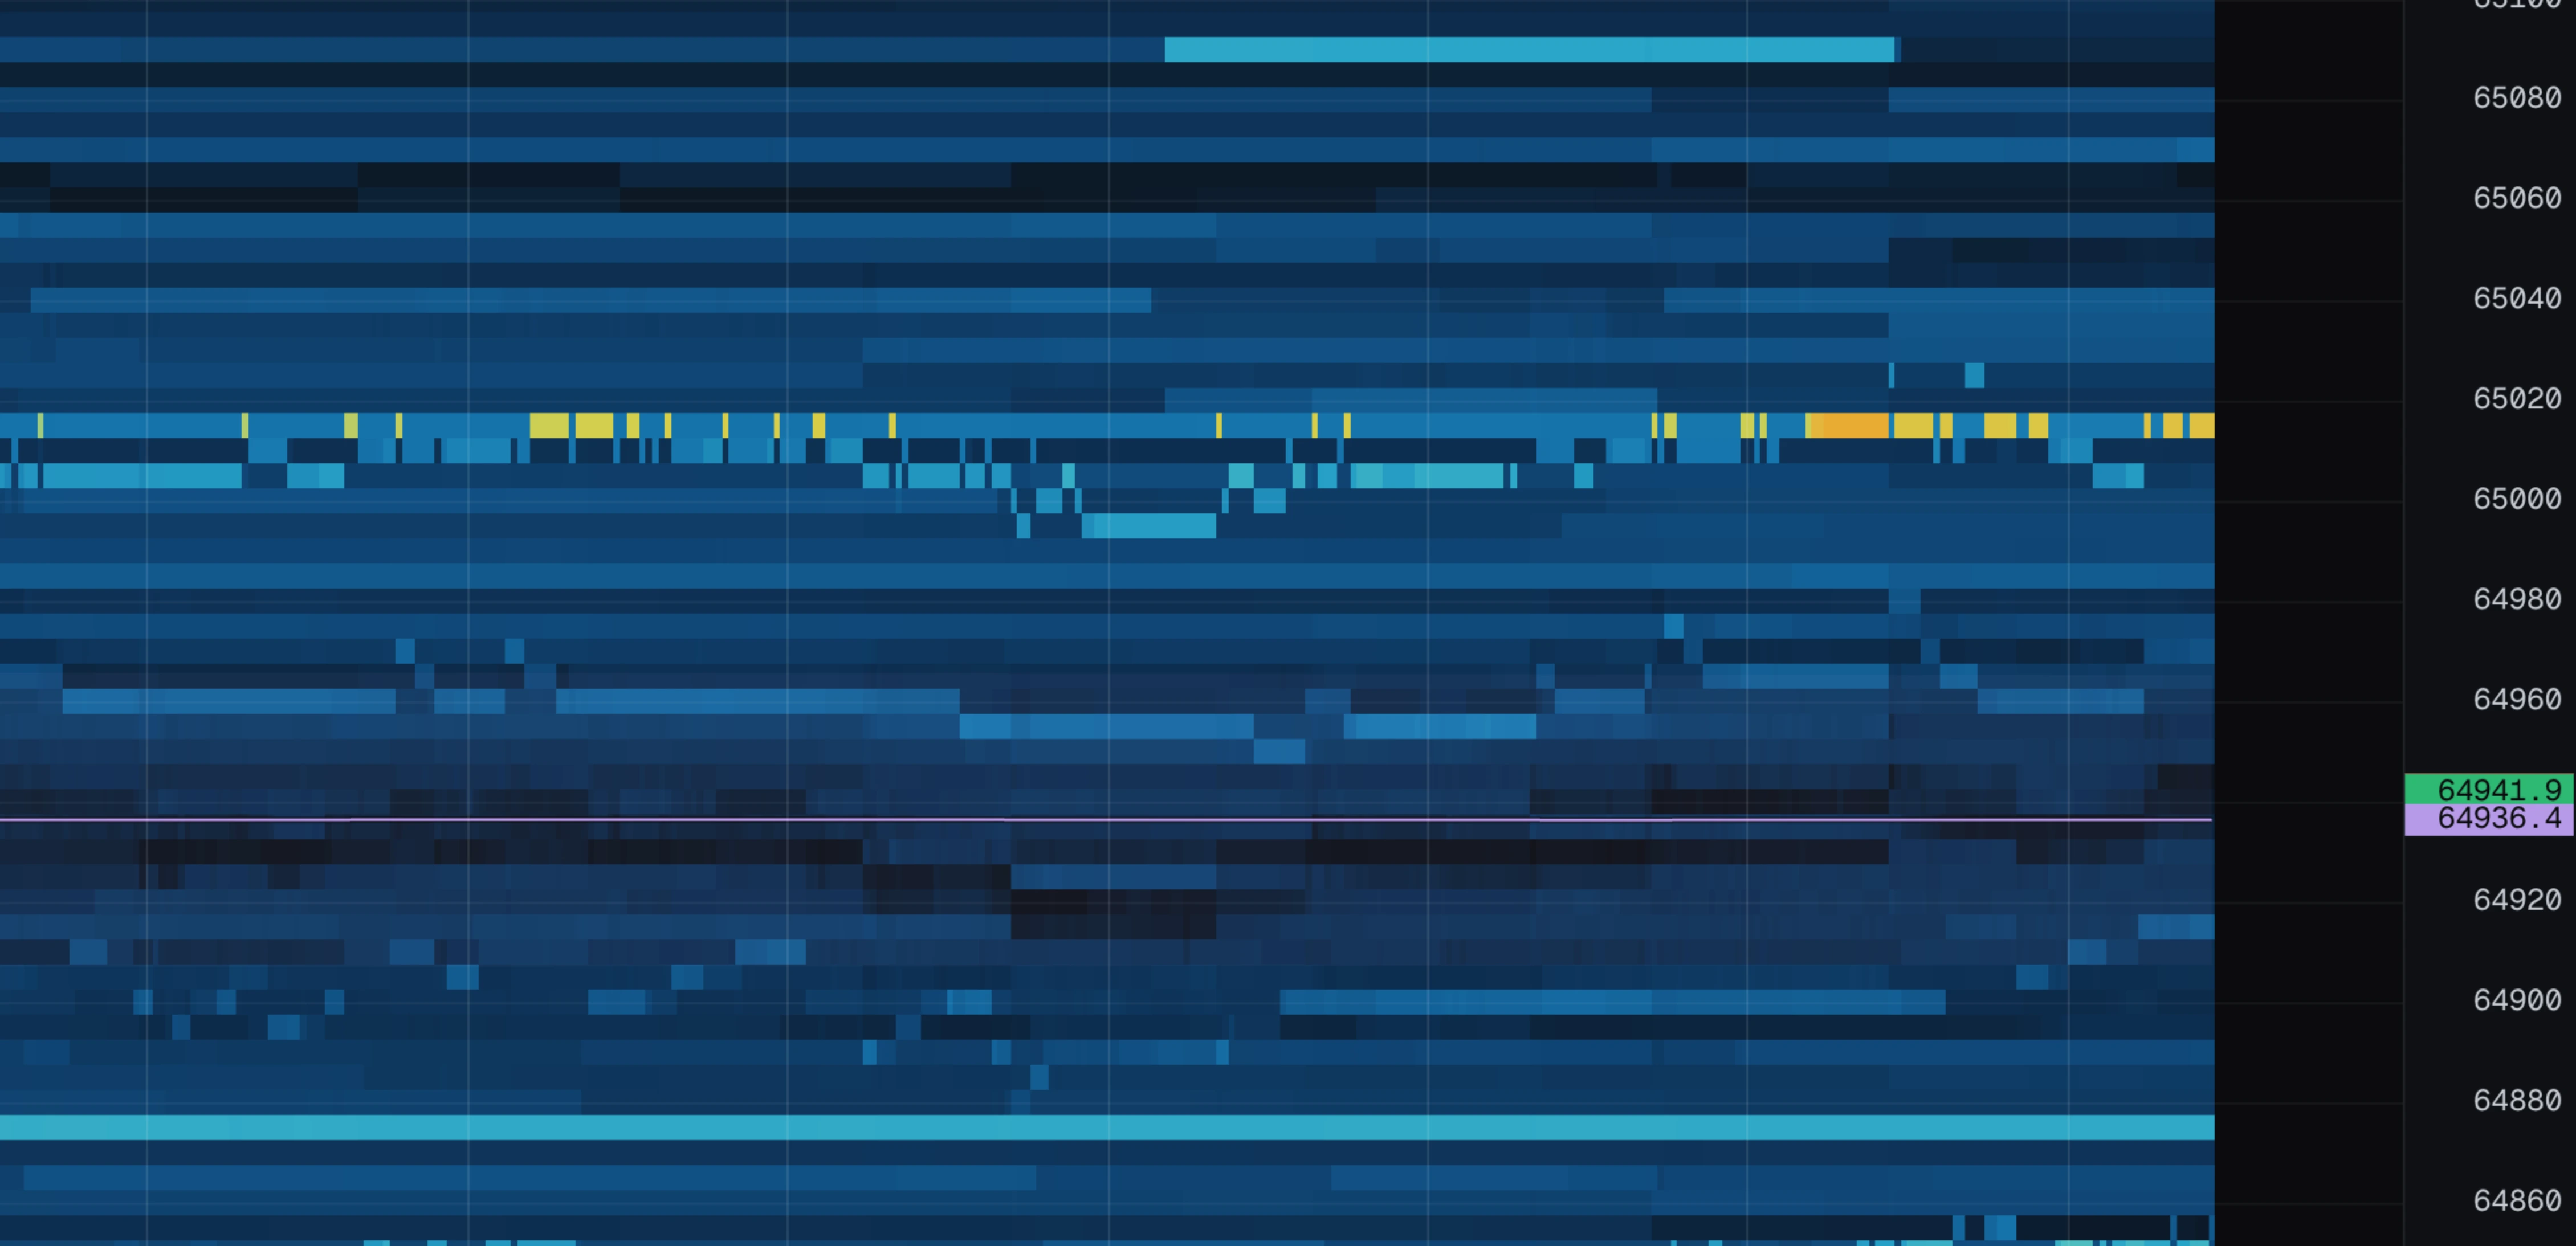
Volume strip
vol draws how much traded in each moment, as bars along the bottom of the chart: green for buys, red for sells, stacked. The scale is set by the busiest bar on screen.
What to look for:
- A spike under a price level that then holds = the level absorbed the attack.
- A run of tall bars while price slides = the move has real volume behind it.
- A flat low strip = ordinary two-sided trading. Nothing to see.
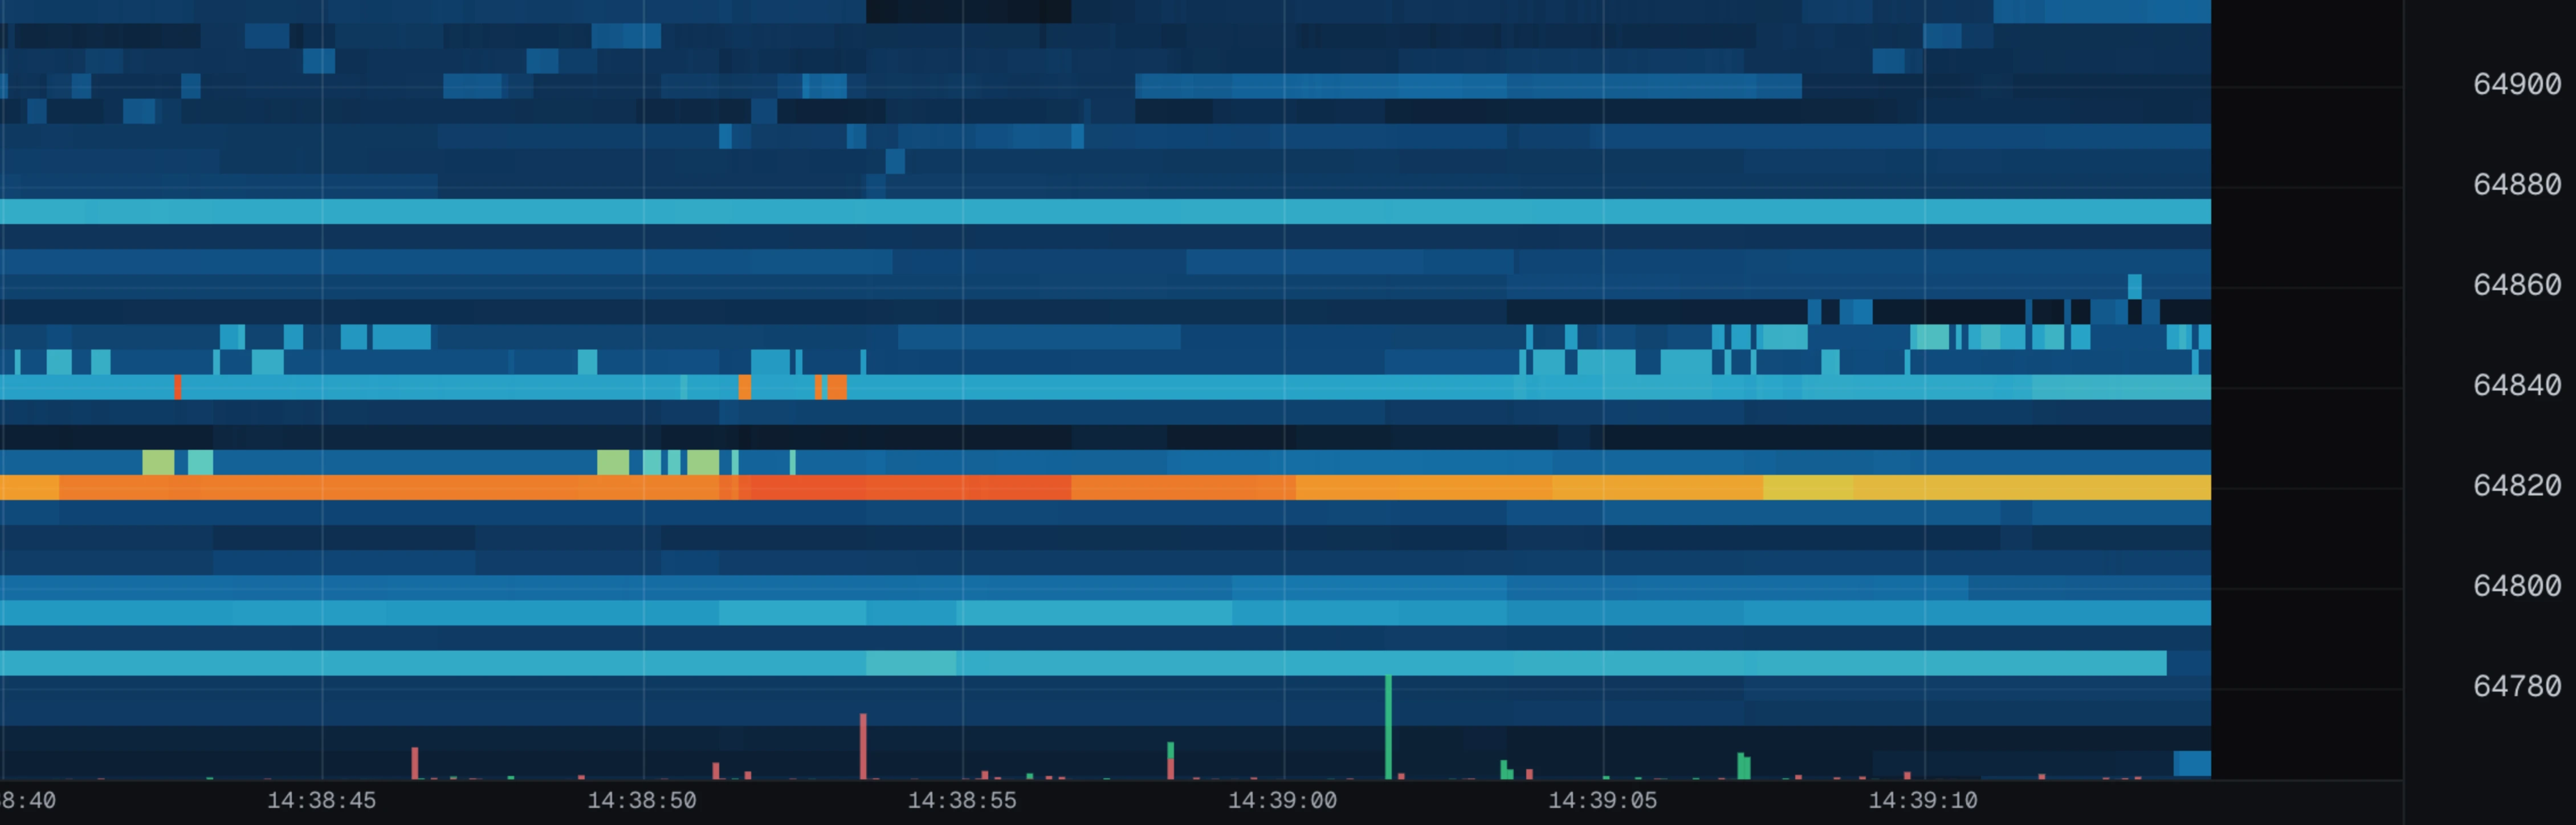
Book imbalance
imb is a thin ribbon along the top of the chart. It compares the order sizes closest to the touch on each side:
- Green = more size waiting on the bid side.
- Red = more size waiting on the ask side.
- A longer bar = a bigger gap. The pane reads out the live number on the right.
Read it as pressure, not prediction: it shows what people are quoting, not what they will actually do. A green ribbon while price falls is interesting exactly because the two disagree — someone is leaning on the bids and it is not helping.
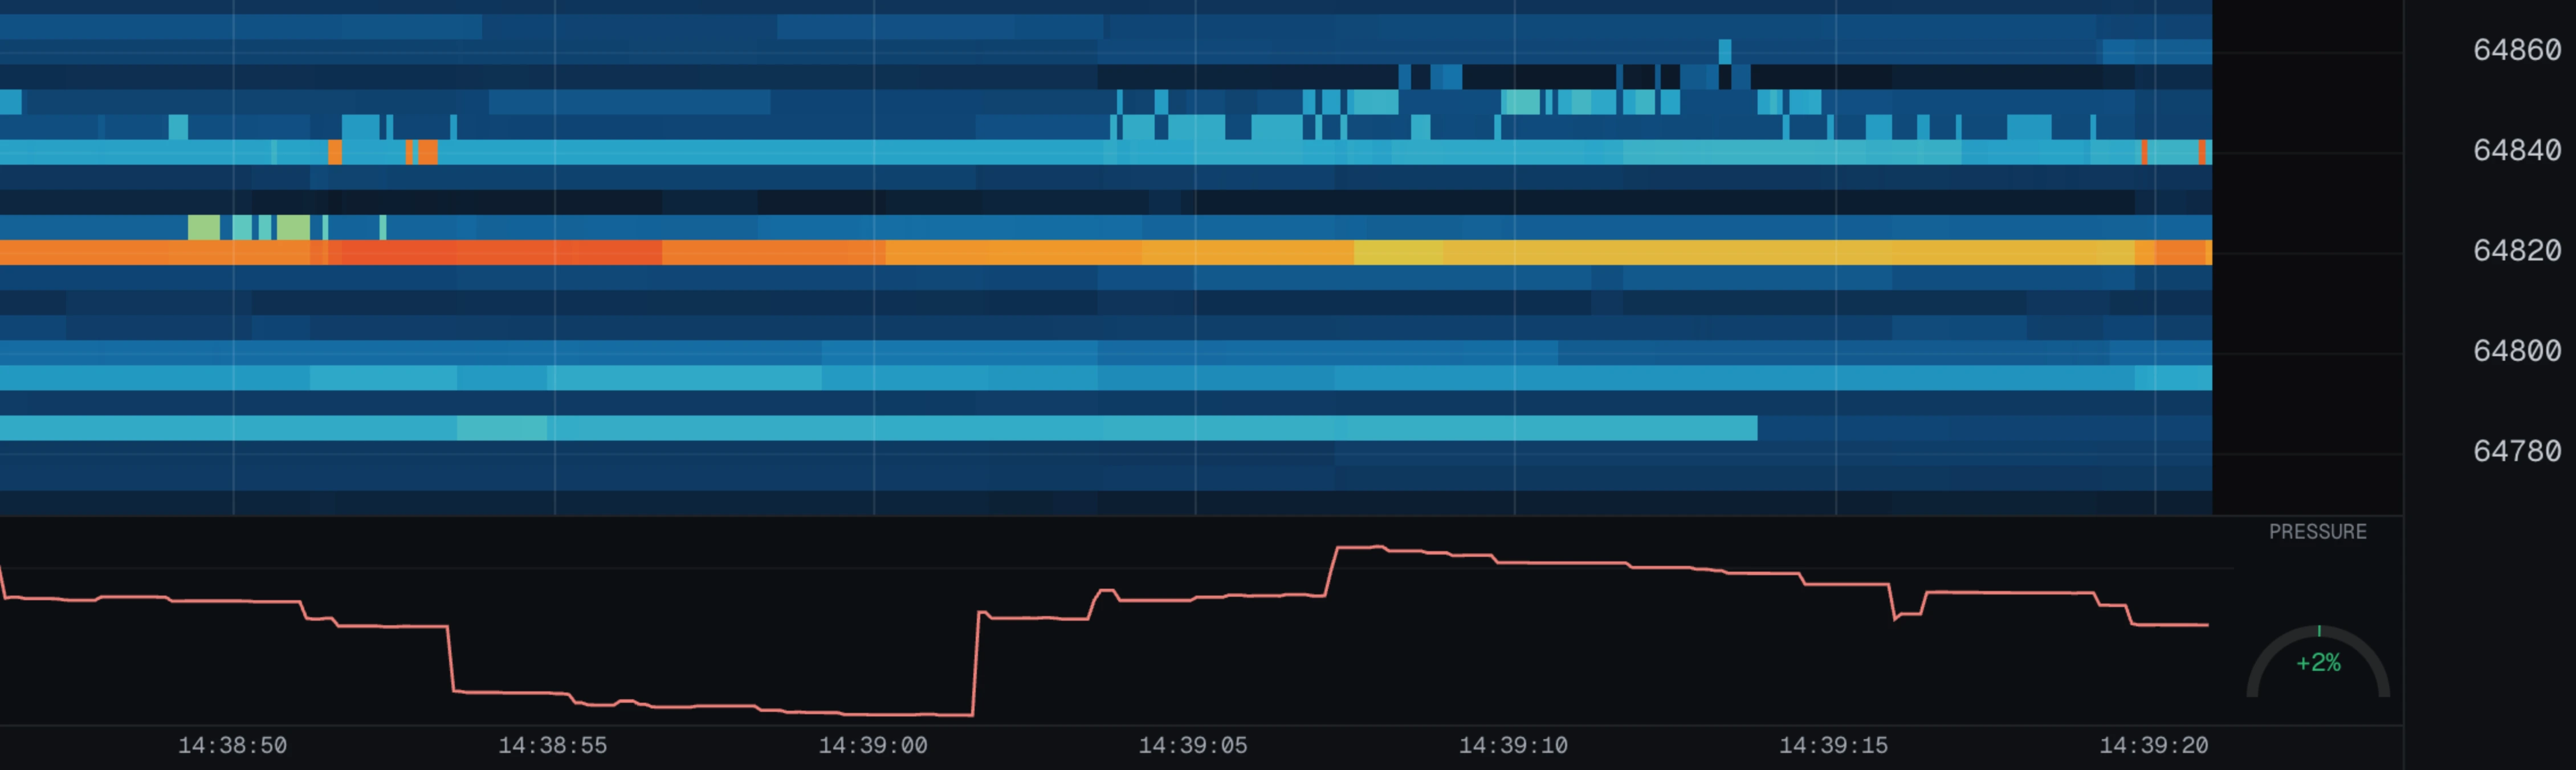
The same number appears twice more: as pressure in the status bar, and as the needle of the pressure dial in the delta pane.
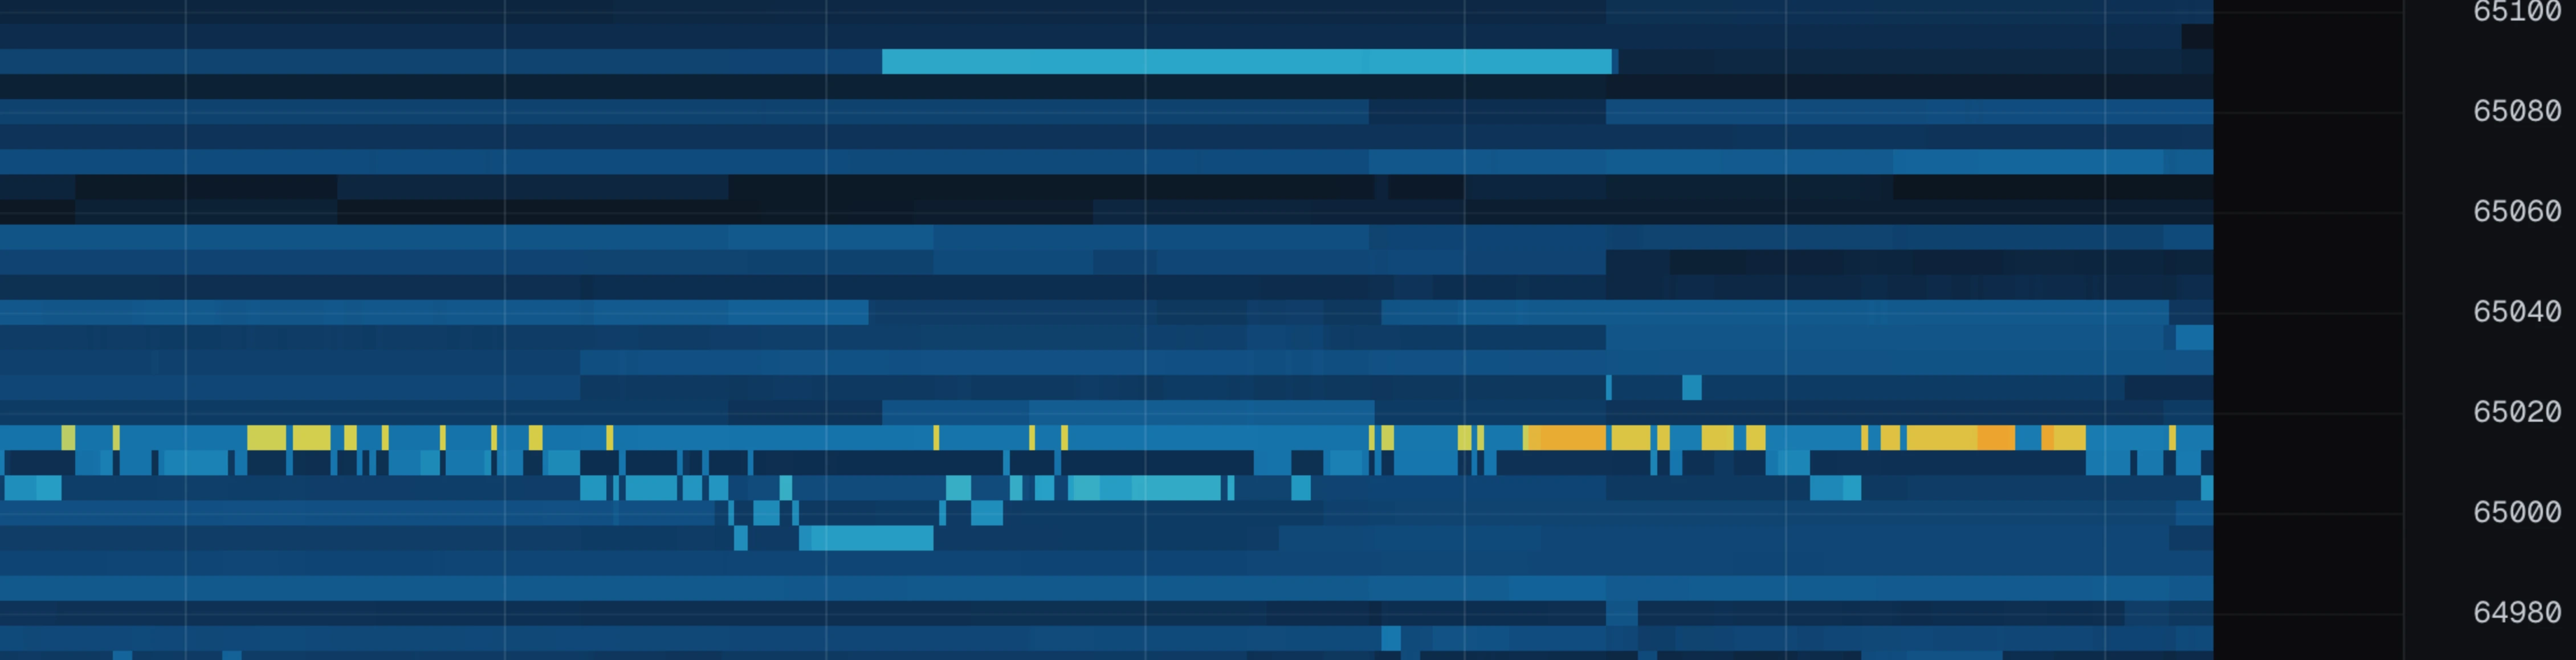
Volume profile
profile shows how much volume traded at each price, drawn down the right side of the chart: green for buys, red for sells.
Two marks come with it:
- Point of control — the amber line across the chart at the price where the most volume traded. Markets keep coming back to the price where the most business was done.
- Value area — the shaded band around it holding 70% of the volume. Its edges are where the market stops agreeing on price.
Pro feature.
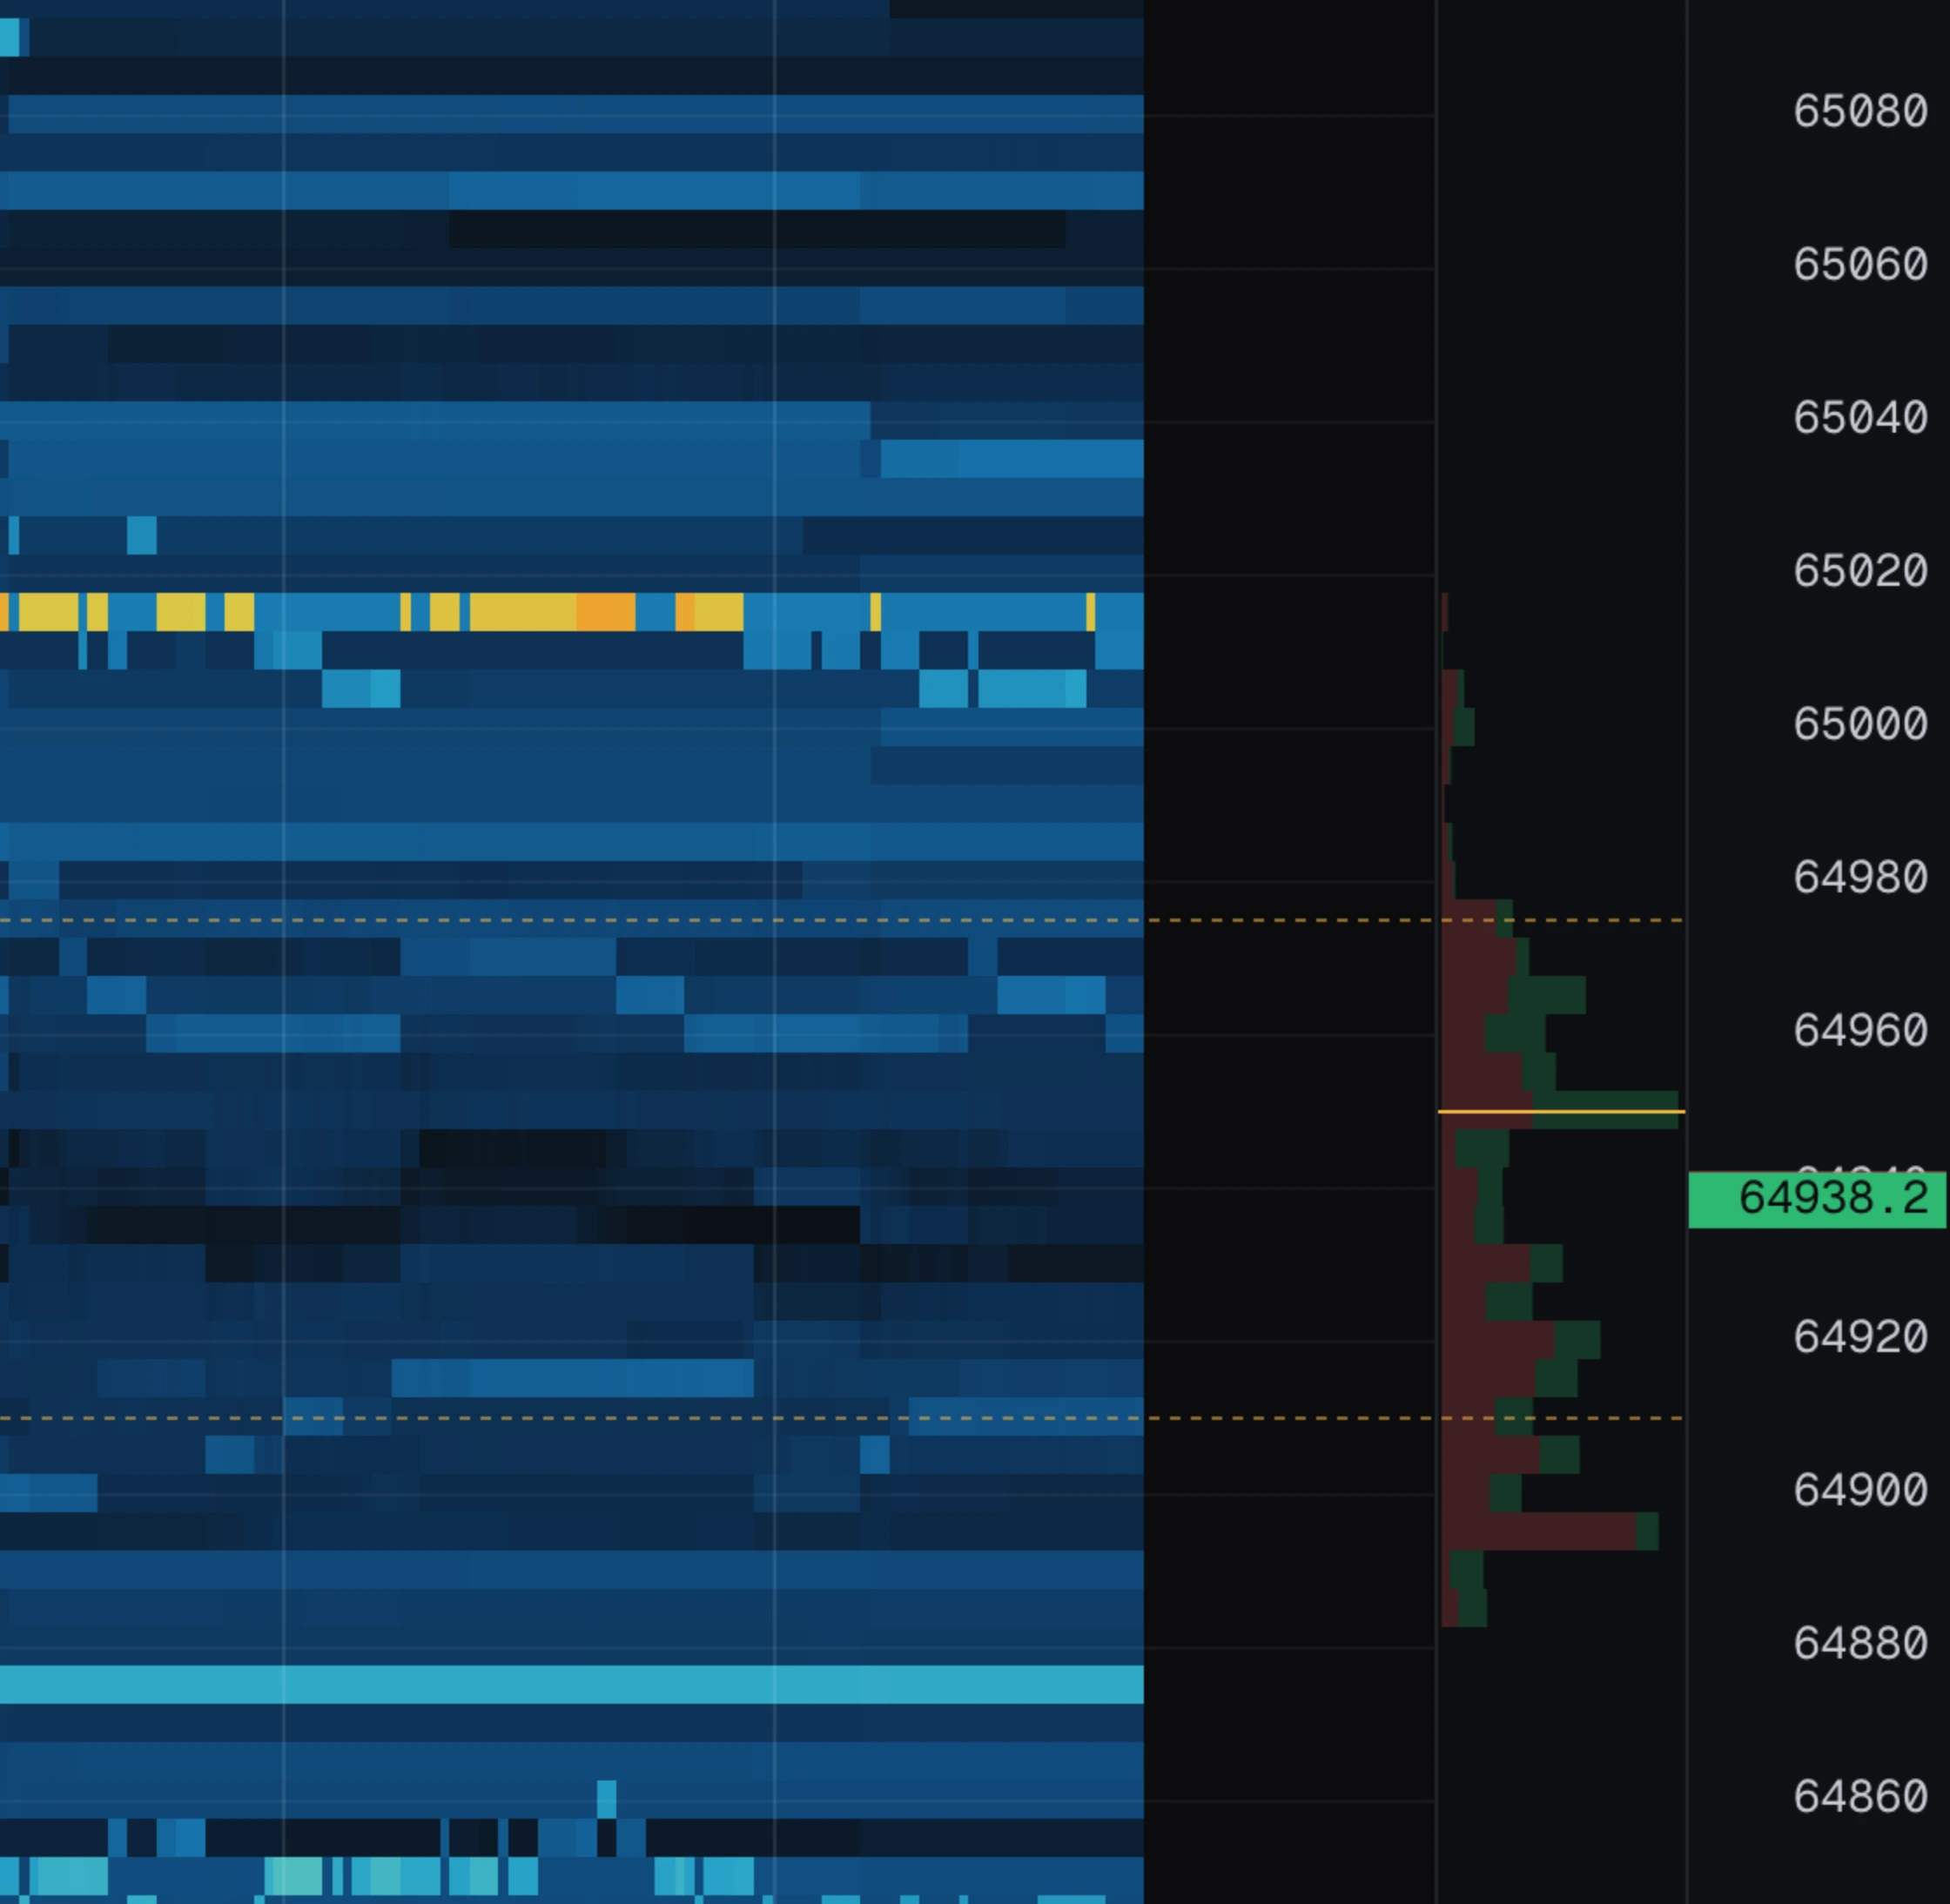
Cumulative delta
cvd opens a pane under the chart with a running total of aggressive buying minus aggressive selling. Going up = buyers have been the aggressor. Going down = sellers have. It resets to zero at the left edge of your window, so it always answers "what has happened since what I am looking at".
The classic read is divergence:
- Price pushes a new high but the line does not = the buying is running out of steam.
- Price makes a new low but the line turns up = sellers are hitting something big and not winning.
At the right of the pane sits the pressure dial. The needle is the current book imbalance — what people are quoting. The number under it is the traded delta — what people actually did. When those two disagree, pay attention.
Level strength
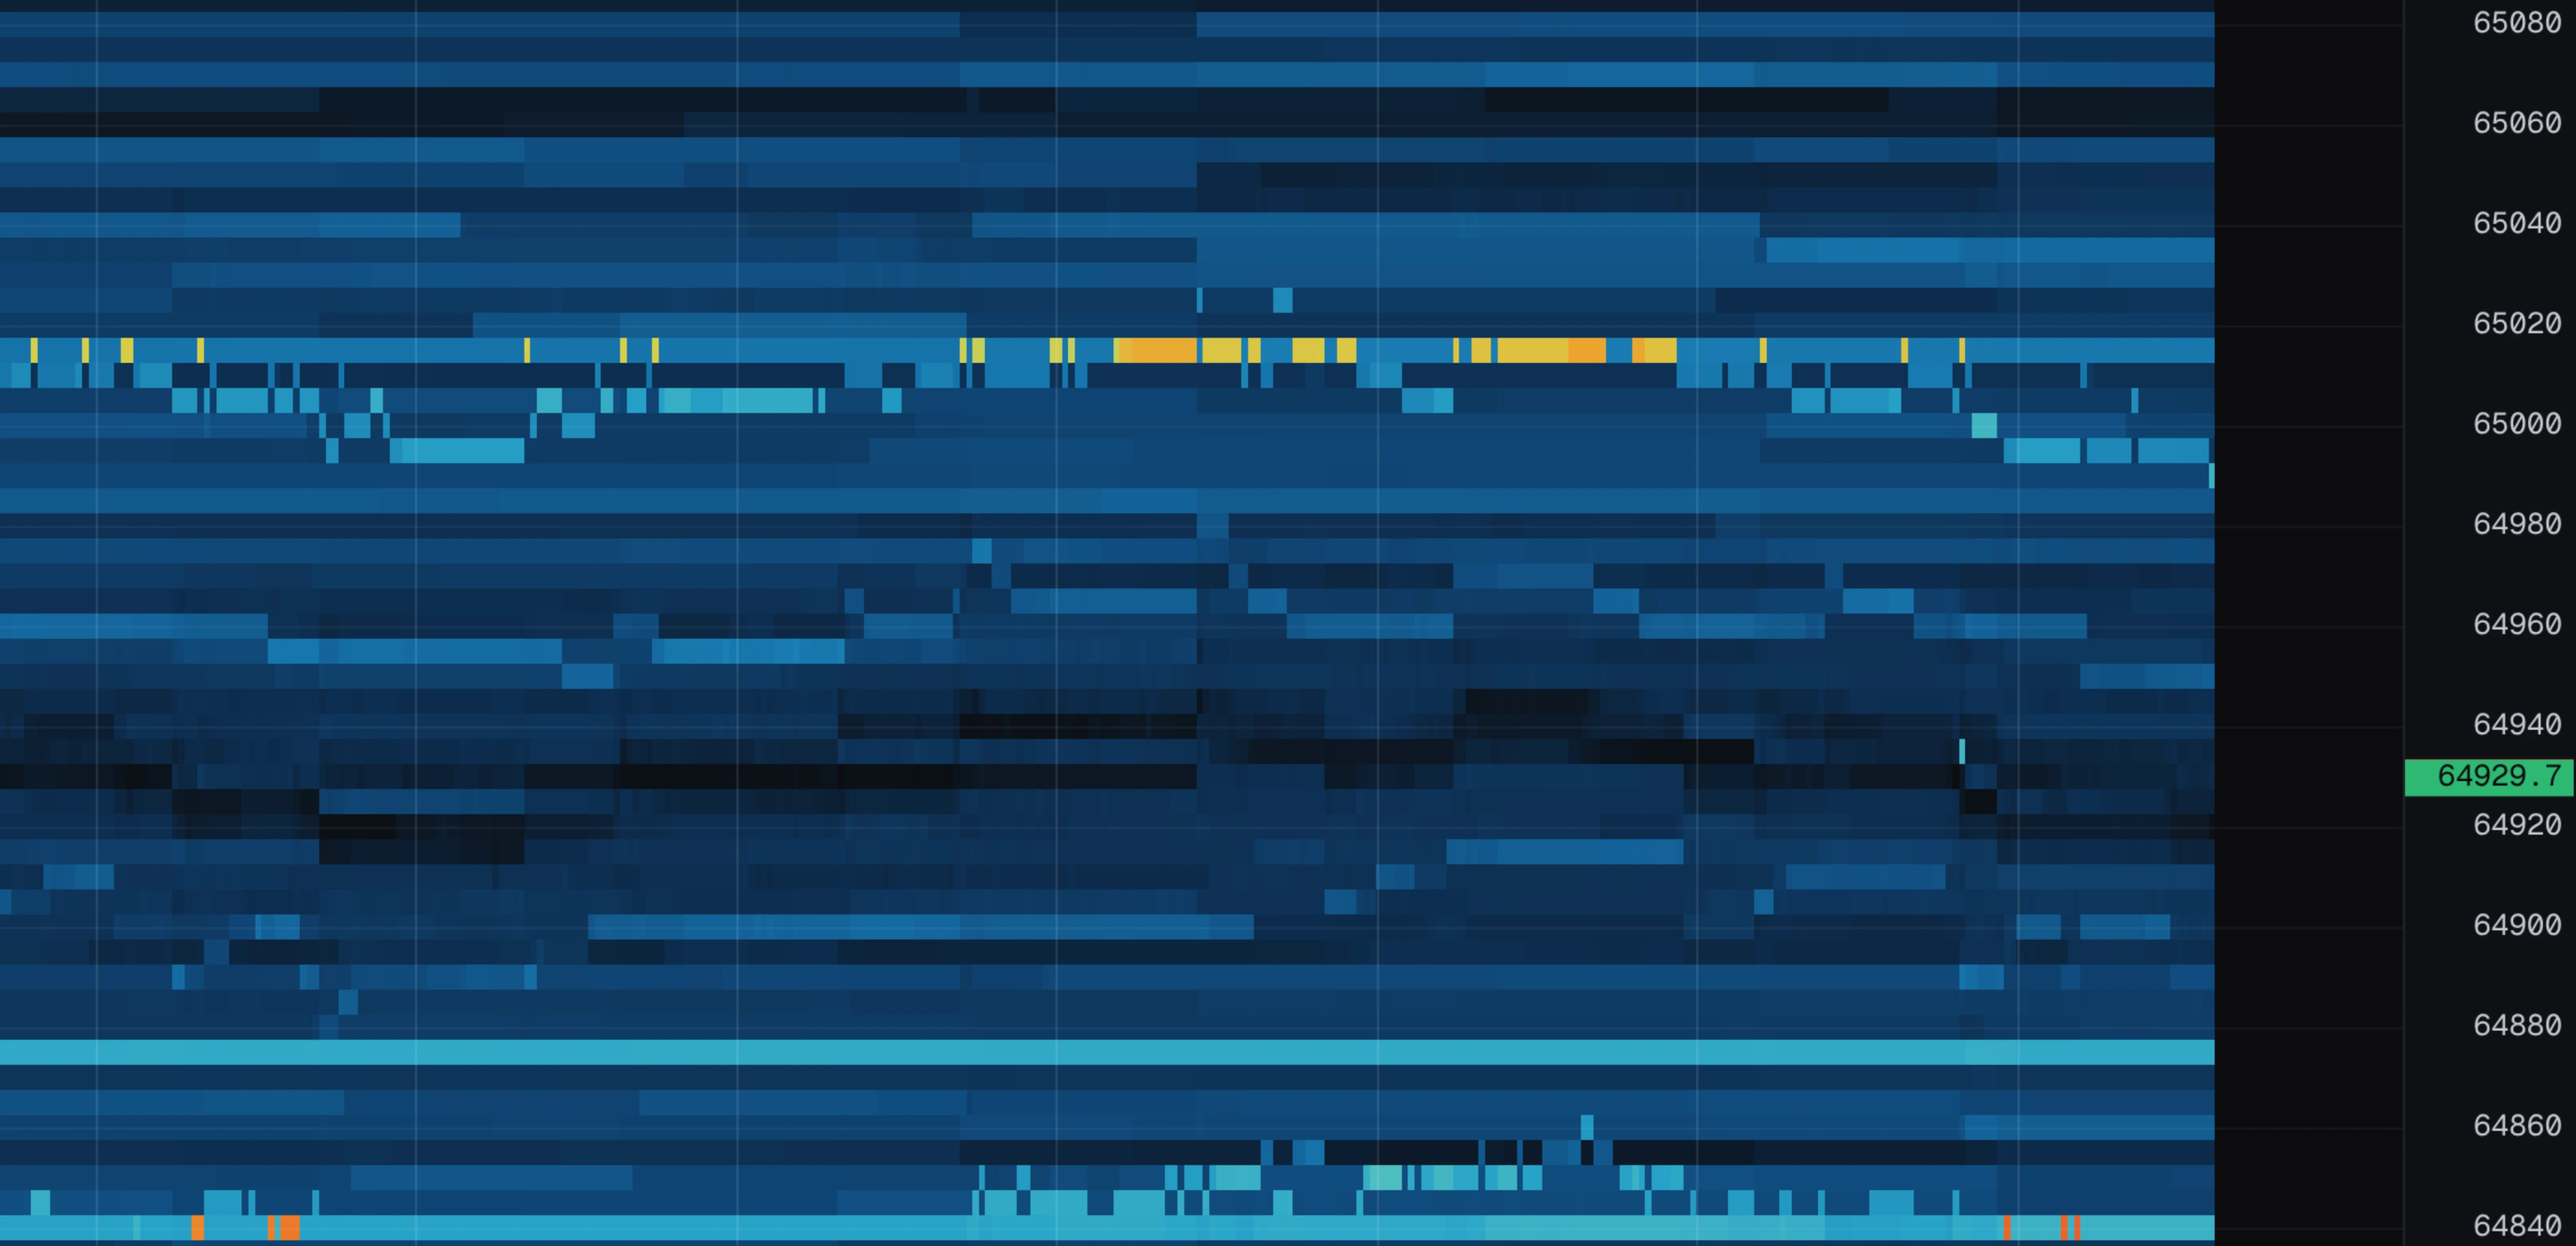
strength tints the rows where real fighting happened. It compares how much volume traded into an order against how big that order ever was.
A plain heatmap shows "an order existed here". Strength shows "someone threw real size at this order":
- Bright row, level held = defended successfully.
- Bright row, level gone = defended and lost. Price now has to reclaim it.
Hover the chart to see the exact numbers for any row: the crosshair shows eaten % and pulled % (see controls).
The wall overlay
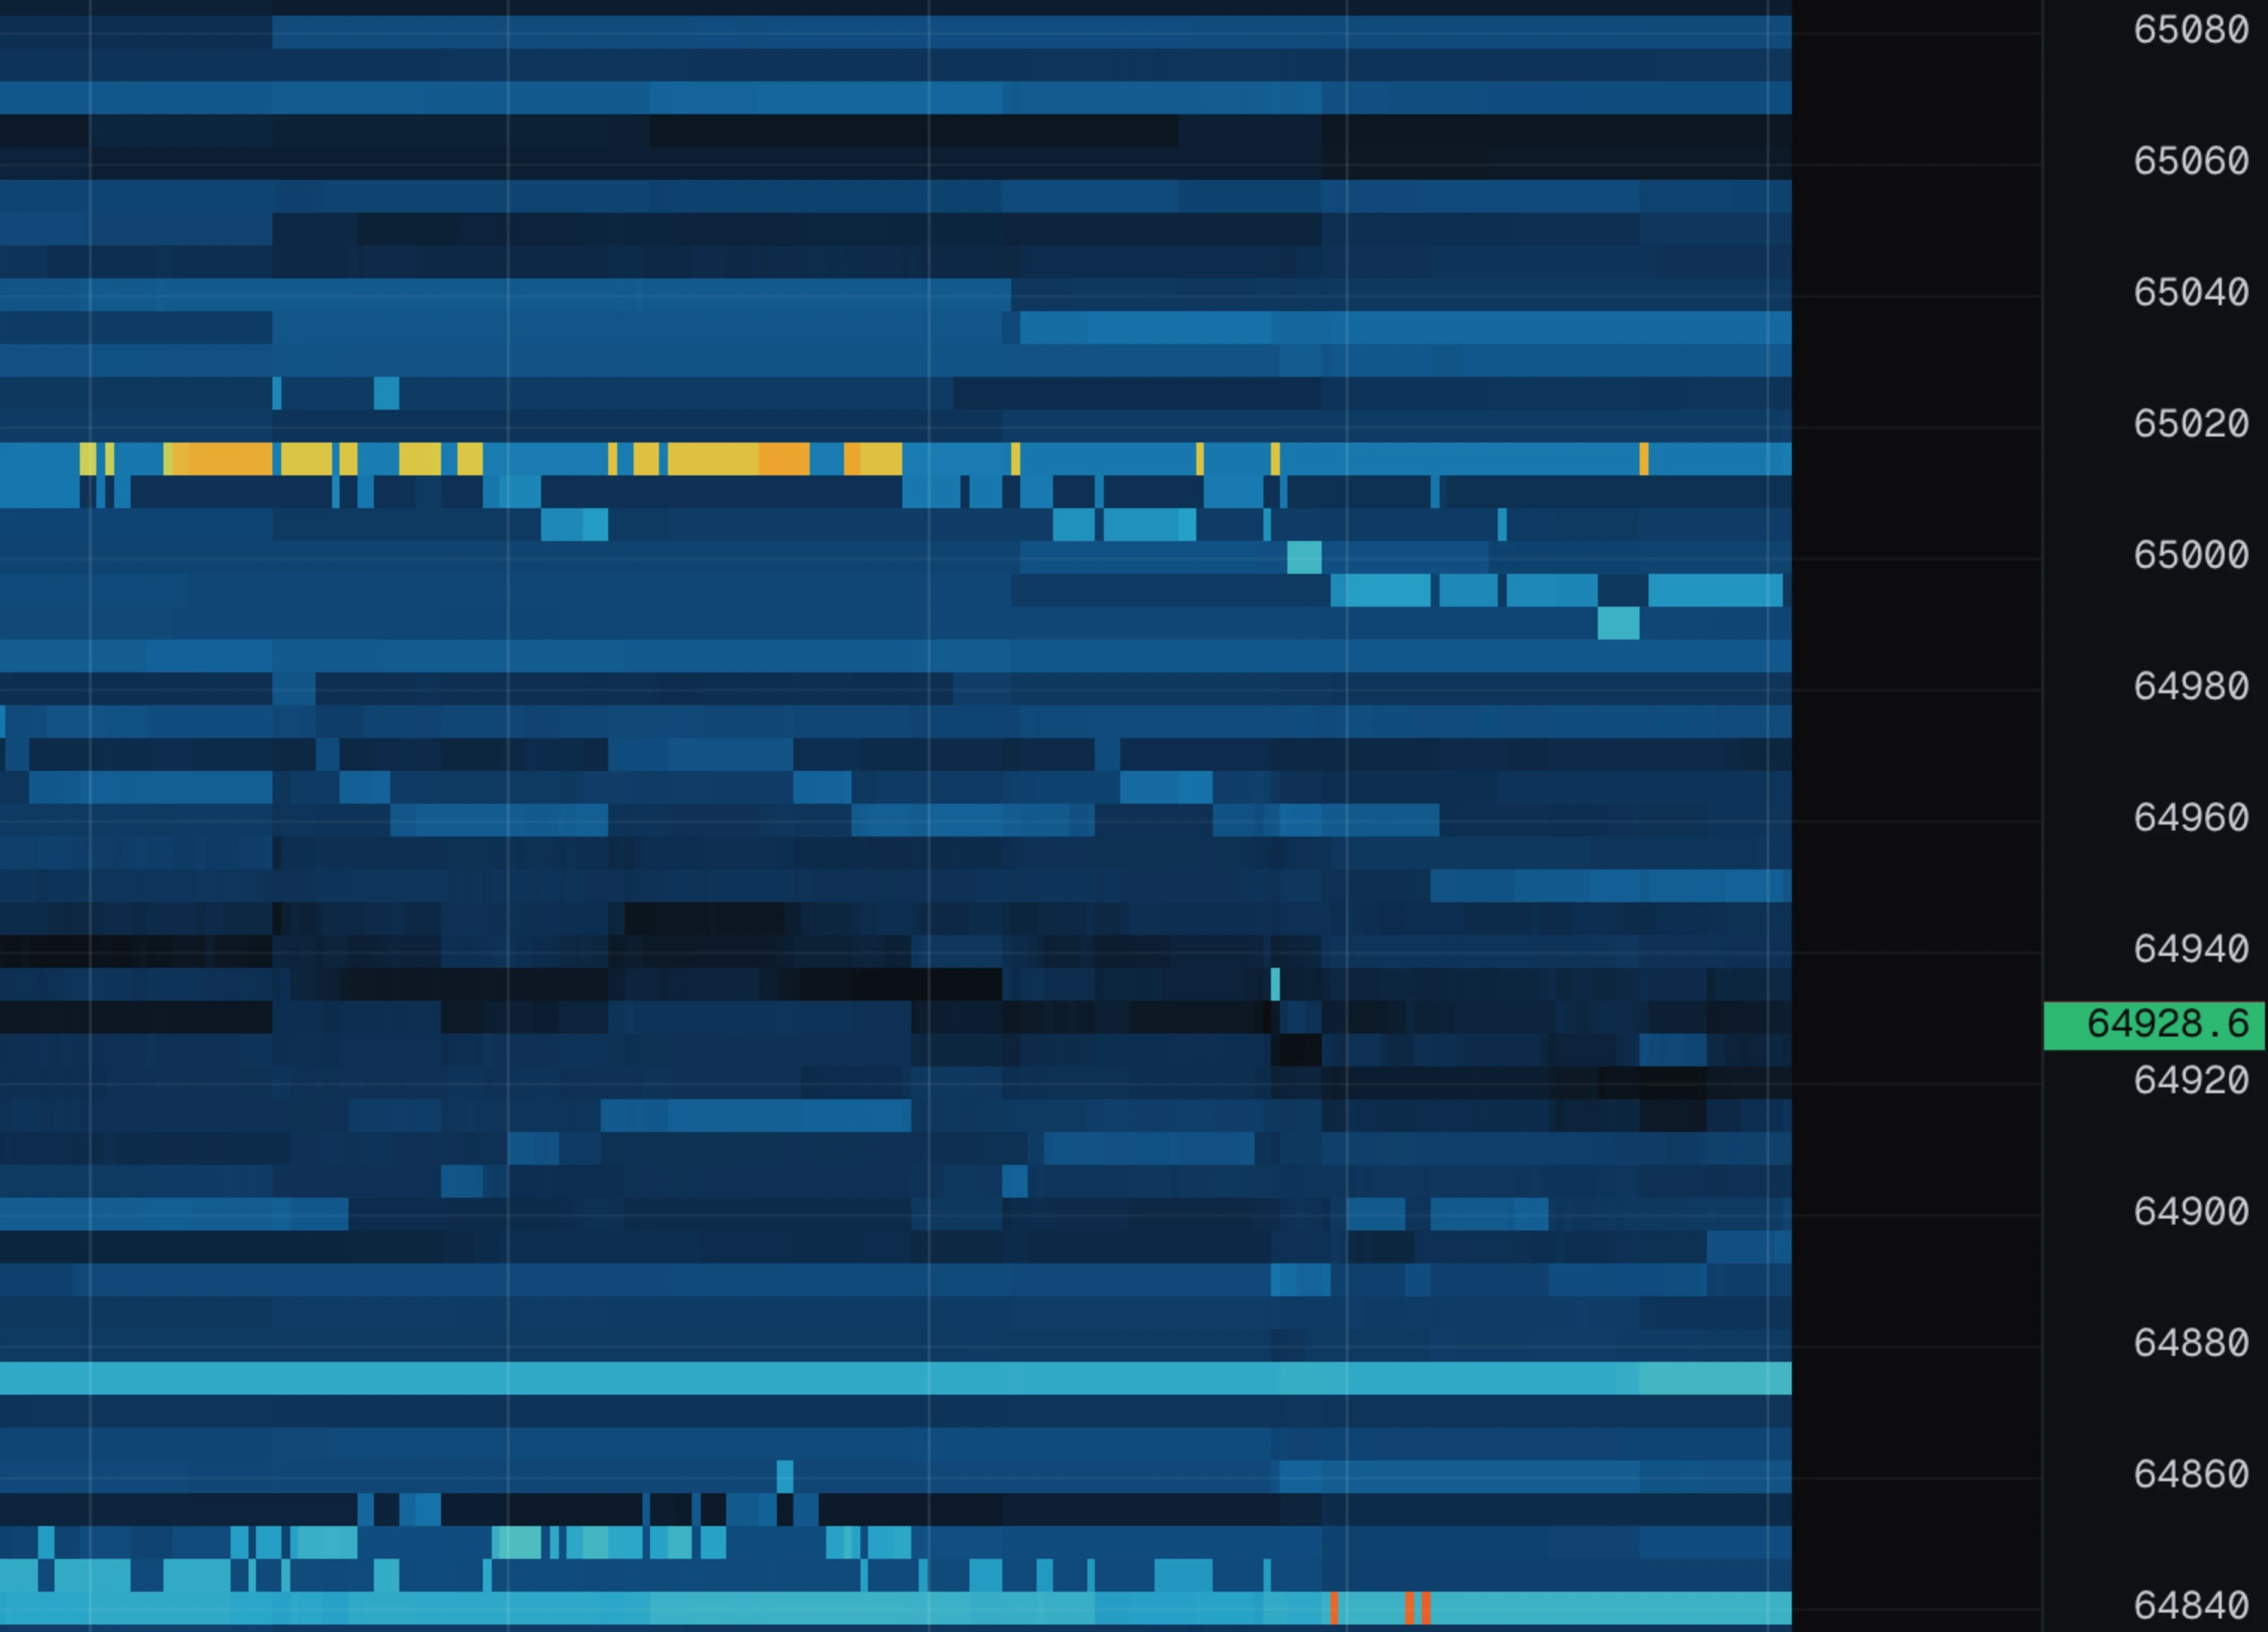
walls draws the big resting orders ("walls") onto the chart itself: a dashed line at the wall's price, its size printed at the right edge, and a small gauge that fills as the wall gets traded through.
The gauge is the tell:
- A gauge that is filling = the wall is being eaten.
- A wall that vanishes with an empty gauge = it was cancelled before it was ever hit.
That difference is exactly what the liquidity panel tracks; this overlay just draws it where you are looking.
Controls and keys
| Gesture | Action |
|---|---|
| Wheel | Zoom time in and out. |
| Shift plus wheel | Zoom price in and out. |
| Alt or Cmd plus wheel | Zoom both at once. |
| Drag | Pan around. |
| Double click | Jump back to the live edge. |
| Space | Pause, and replay from there (see replay). |
| L | Jump back to the live edge. |
The crosshair
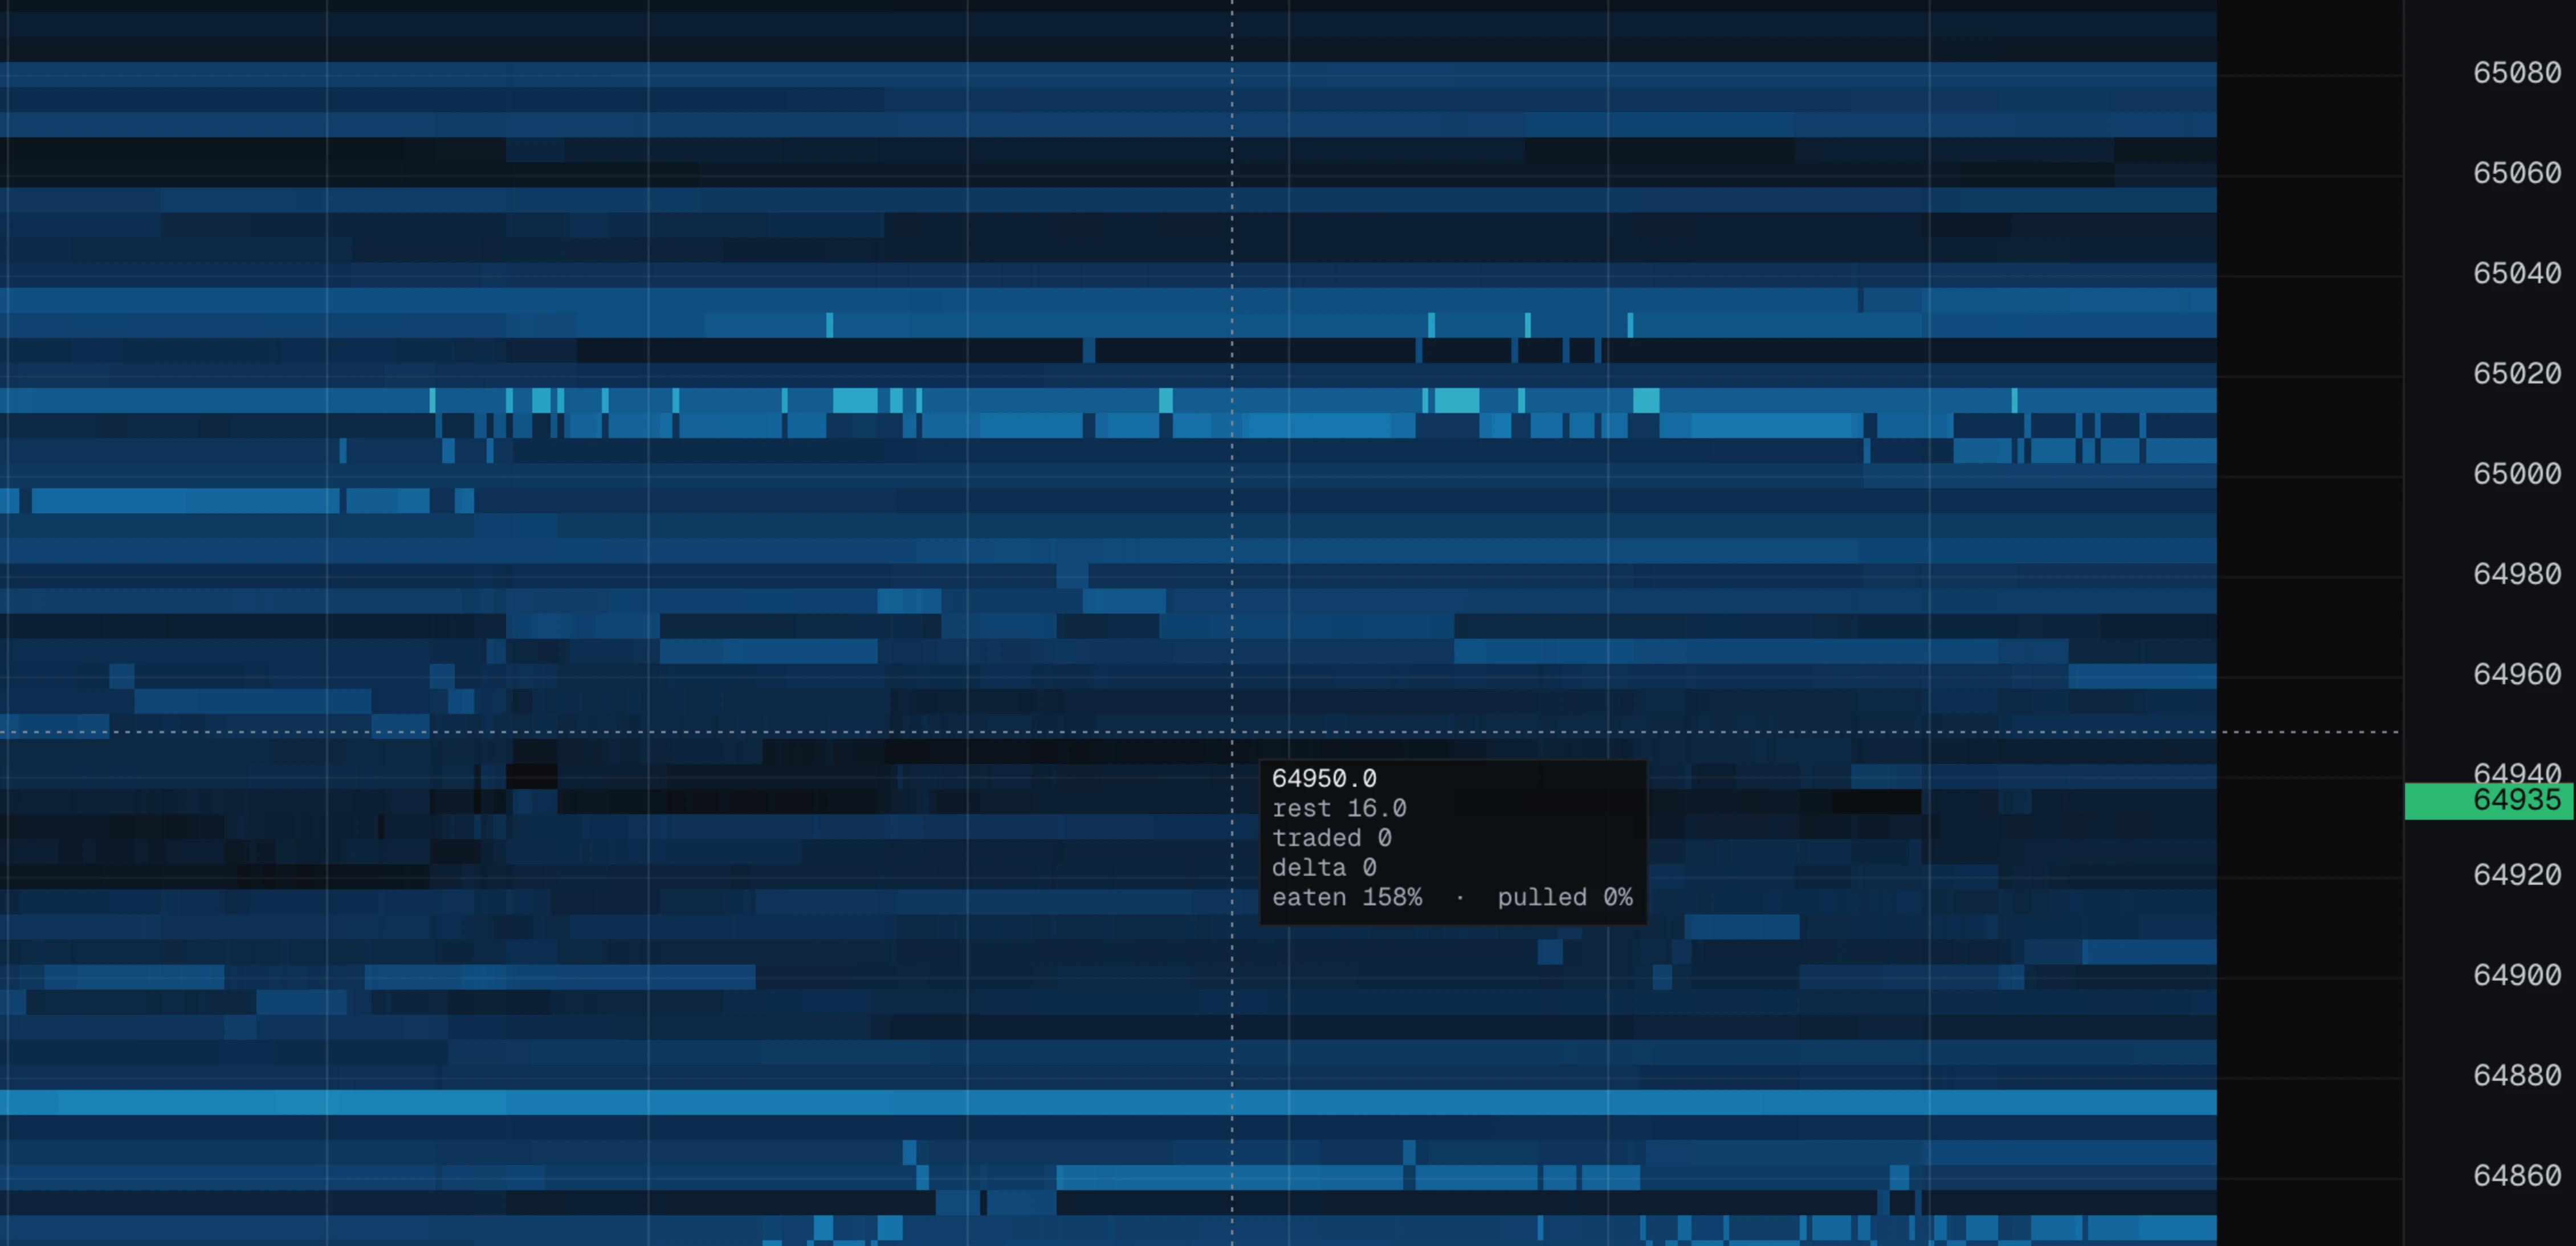
Hover anywhere on the chart and a crosshair appears with a small box of exact numbers for the spot under the pointer:
- price — the price of that row.
- rest — order size waiting there at that moment.
- traded — what traded there in that moment.
- delta — that volume, buys minus sells.
- eaten / pulled — how much of the biggest order ever seen at this price was traded away vs cancelled. This is the number behind the strength tint.
This works anywhere in the kept history, including while scrubbing through replay.
Flow signals
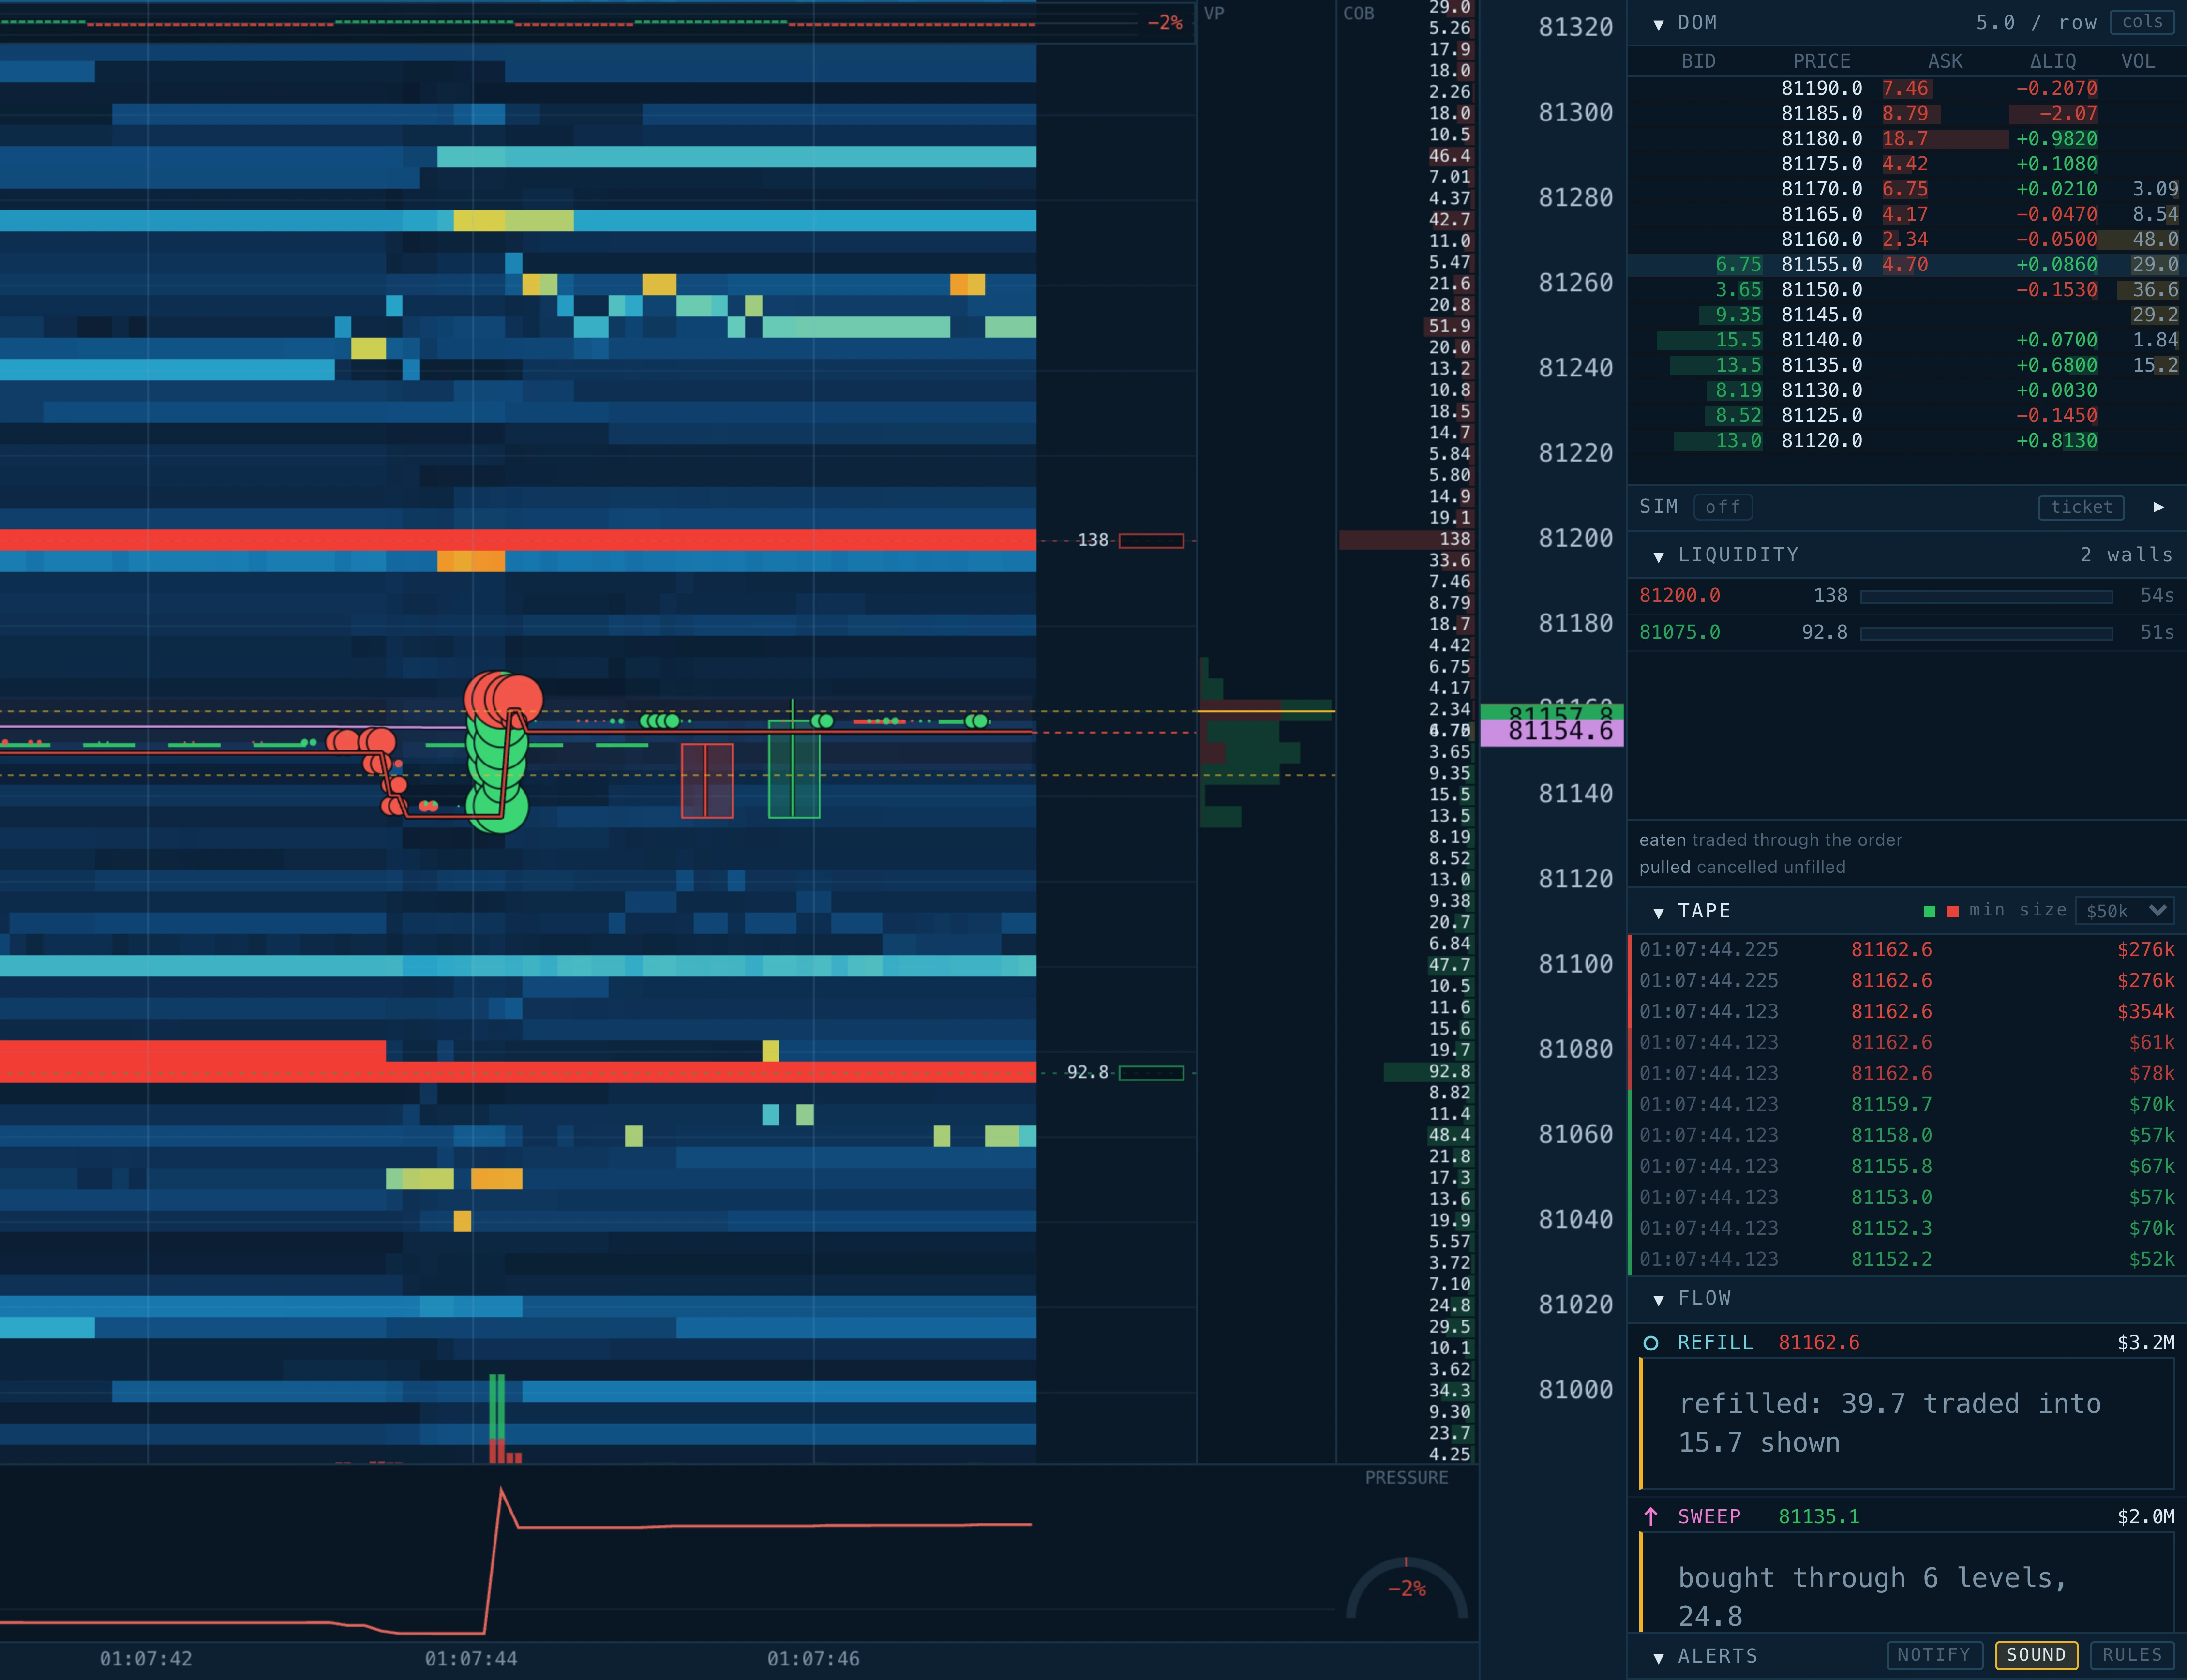
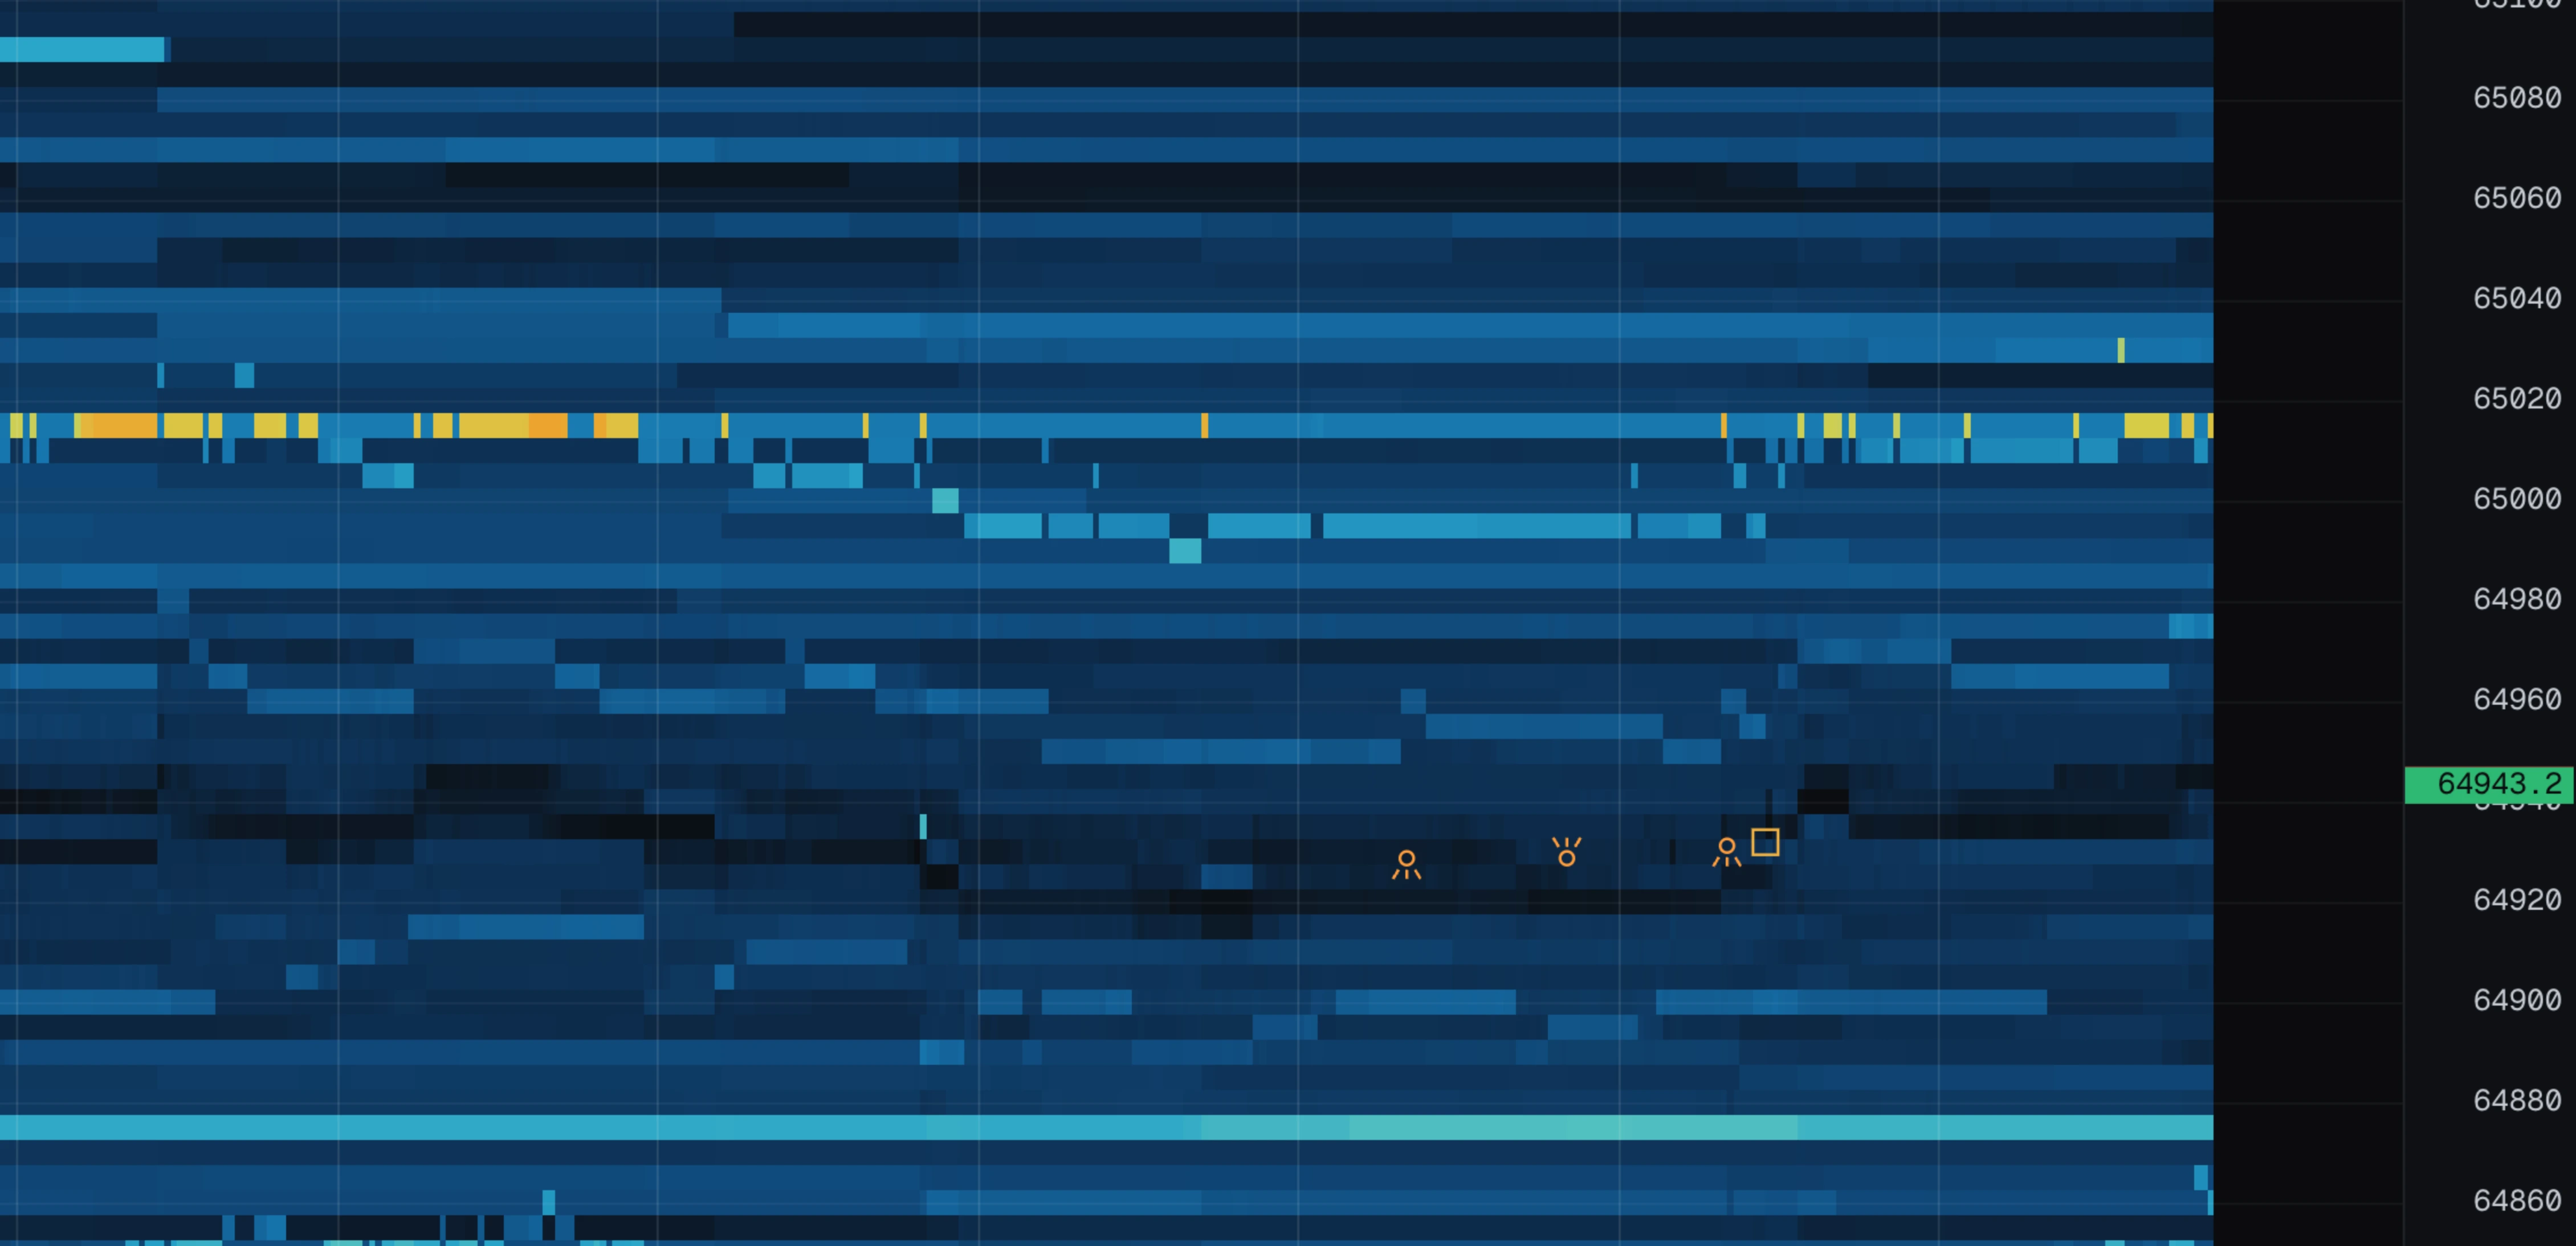
The flow panel is an alert list. It watches the book and the tape and flags things you would want to know about, newest first. With flow turned on, the same events are also drawn on the chart at the price and moment they happened.
Every alert respects the min size setting, so tiny prints do not spam the panel.
| Alert | Looks like | Fires when |
|---|---|---|
| BLOCK | amber circle | A single trade much bigger than usual. "Usual" is learned from the recent tape, so it adapts to each coin instead of using one fixed size. |
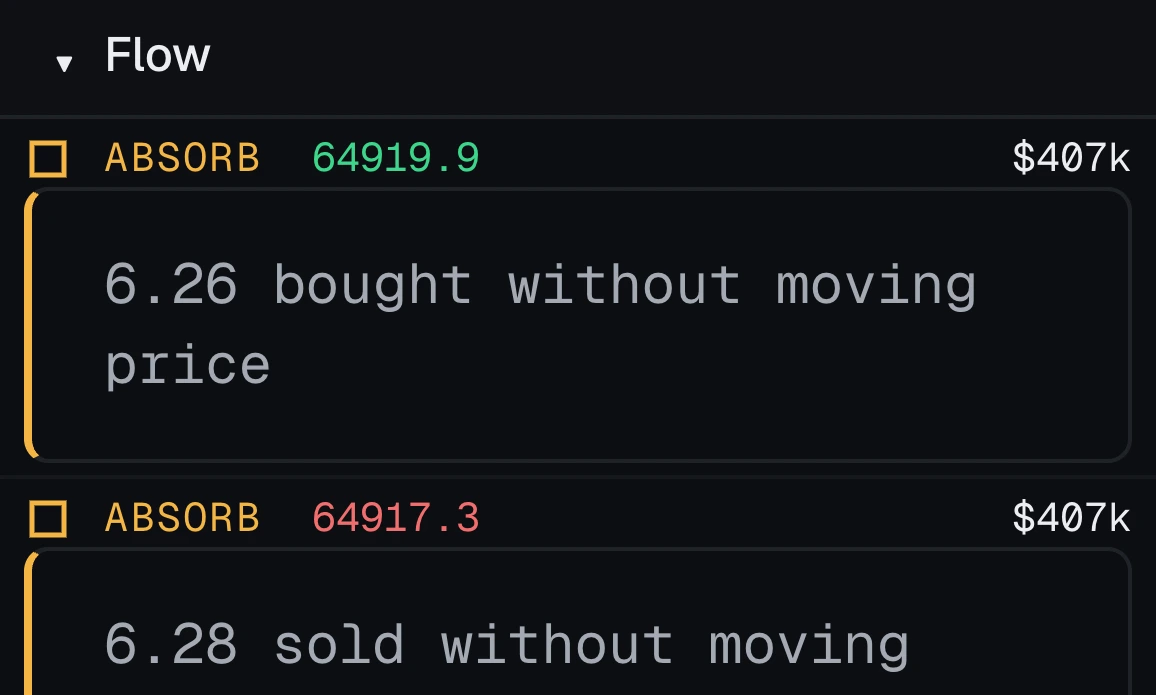
| ABSORB | amber square | One side traded hard for about five seconds while the price barely moved. Something big is quietly soaking it all up. |
| REFILL | small cyan circle | More volume traded at a price than was ever shown resting there. The only explanation is a hidden order that keeps refilling — an iceberg. |
| SWEEP | magenta arrow | One aggressive order ate through four or more price levels in a single moment. The arrow points the way the book was taken. |
| PULLED | red open cross | A big order was cancelled before it got hit. The level was never really defended. The subset where price had actually arrived at it reads as SPOOF? instead — an alert rule naming PULLED still catches those. |
| EATEN | green diamond | A big order was traded through. It was defended, and it lost. |
| SPOOF? | red cross in a dashed box | A big order the market actually reached, cancelled without trading. See spoof candidates. |
| STOPS | amber hook through a bar | A prior high or low broke on a burst, and price came straight back. See stop runs. |
| LIQ | orange burst | The exchange force-closed someone's position. See liquidations. |
The panel doubles as the legend: the little shape in each row is the same shape the chart draws for that alert. Find the row, and you know what the mark on the chart meant. Each row shows the price, the dollar value, a one-line note and the time.
Alert rules
The flow panel lists everything the detectors saw. Alert rules let you pick what you actually want to be told about: open the ALERTS panel, press rules, and add one.
A rule is three questions:
- Which events? Pick the kinds — BLOCK, ABSORB, REFILL and so on. Nothing picked means every kind.
- Which side? Both, or only buys, or only sells.
- How big? A minimum dollar value. Leave it empty to accept anything that clears the min size floor.
When a rule matches, a toast appears at the bottom left of the chart. Click it to jump the chart to the moment it happened — the fire is an annotation on the chart, not just a message. The same fires are listed newest first in the alerts panel itself.
The notify chip also raises a system notification while the tab is in the background, so a position can be managed elsewhere while the book is watched here. The browser asks for permission once, when you first turn it on.
Wall tracking
This panel tracks big resting orders ("walls") and reports what happened to them. The whole point is one distinction:
- Eaten — the wall was traded through. It was real, and it lost. Price now has to reclaim that level.
- Pulled — the wall was cancelled before it was hit. It looked like support; it never was.
A plain heatmap shows both as "an order appeared and disappeared". This panel tells you which one actually happened.
How it works
The book shows the size at a price before and after each update, and the tape shows exactly what traded in between. Anything that vanished without trading must have been cancelled. The maths is exact, not a guess.
What counts as a wall
Anything bigger than about 1.1 times the same reference level the colour scale uses — so "wall" means the same thing on every market, without a fixed number that means one thing on BTC and another on a thin altcoin.
The three endings
- Eaten — at least half of its peak size was traded through. The panel keeps the dollar value that went in, so "cost real money to clear" is visible.
- Pulled — at least 55% was cancelled, with under 20% traded. Someone changed their mind.
- Faded — it drifted away slowly without doing either. Dropped silently, because neither story fits.
The panel
Live walls at the top, with price, size, a traded-through gauge and how long they have sat there. Resolved events below, with what happened and how far from the price they sat — a pull right at the touch matters more than the same pull far away.
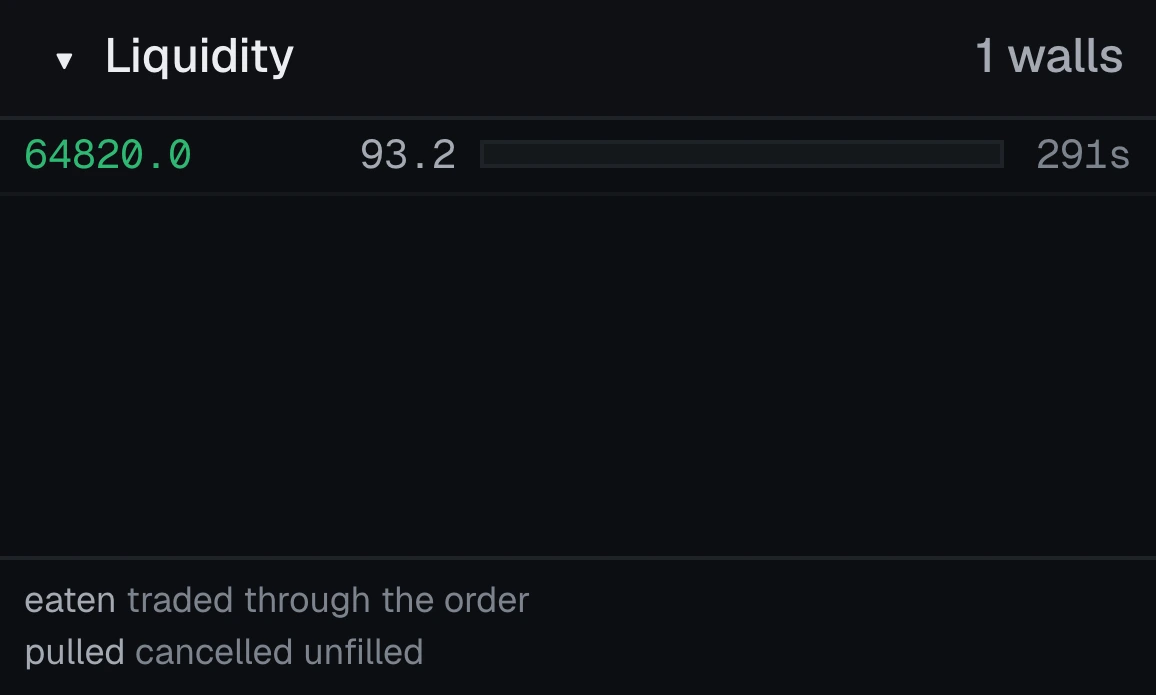
During replay the panel hides live walls (a wall resting now describes a book from another moment) but still shows what had already been pulled or eaten by the point you are looking at.
Turn on walls to draw them on the chart itself: see the wall overlay.
The depth ladder
The ladder is the order book as a list: bid size, price, ask size, at the same price steps as the chart — a level in the ladder is the same price band as the row beside it on the chart.
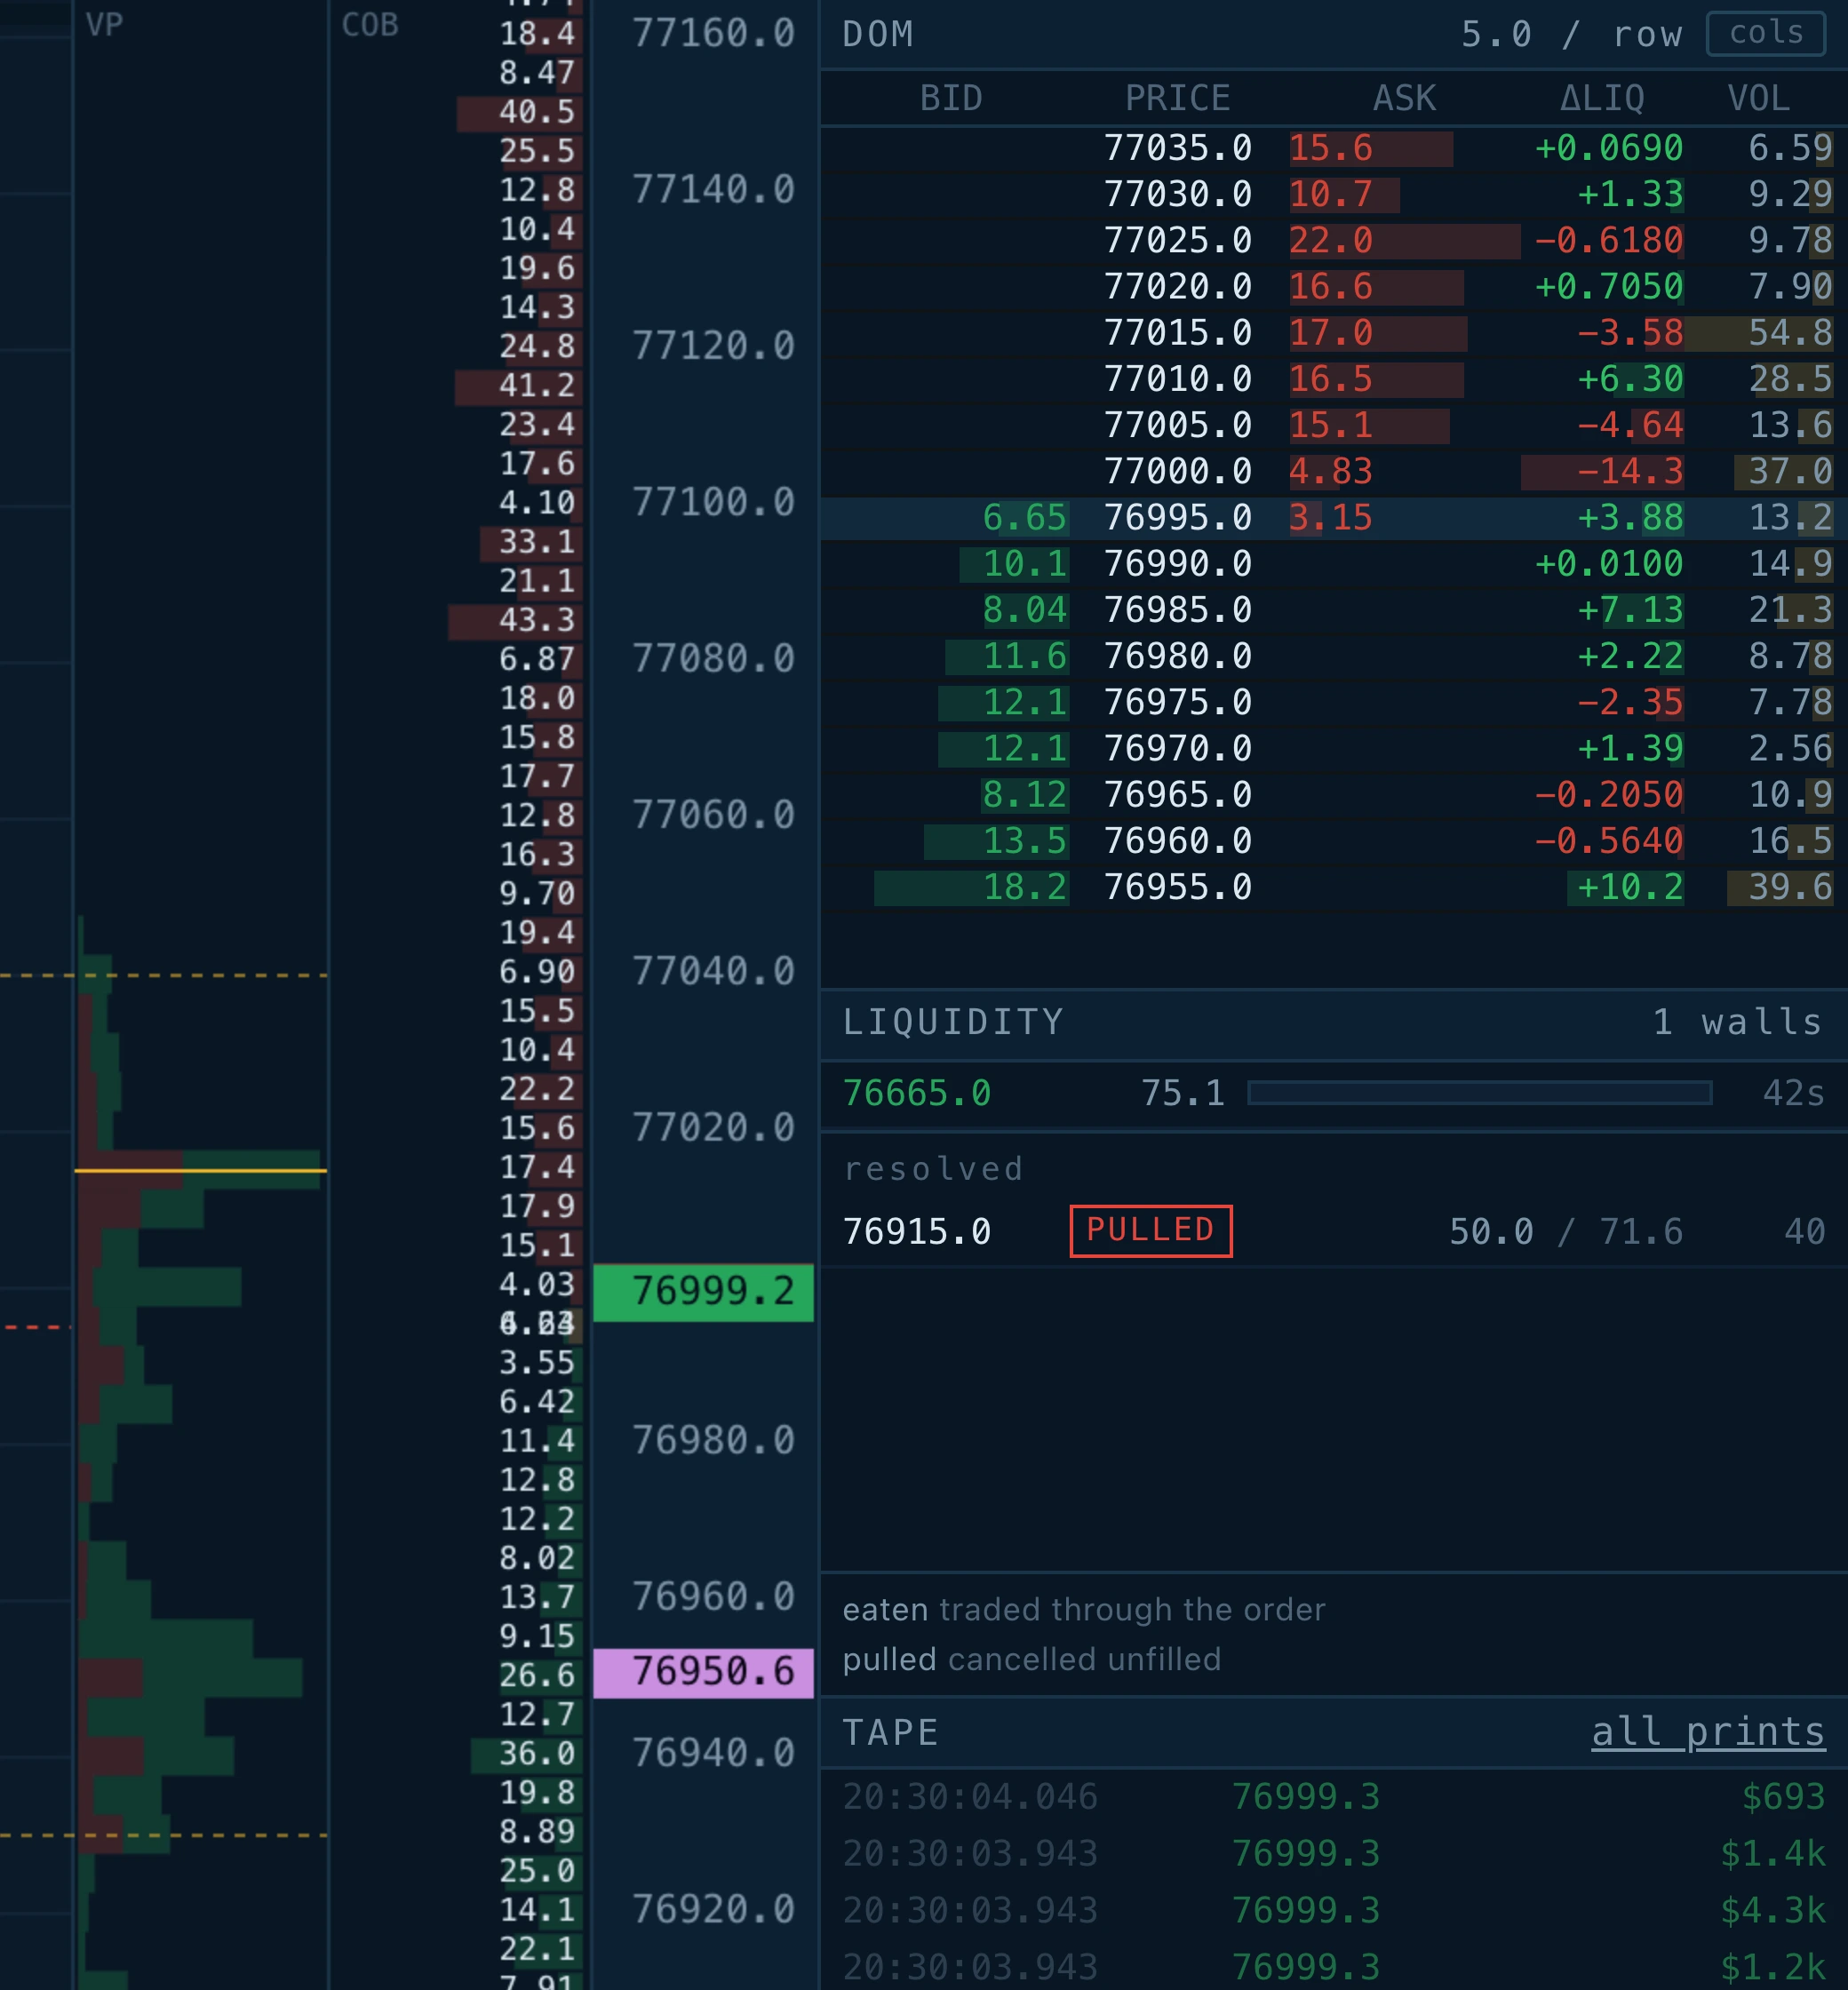
Beyond those three columns, you can switch on more statistics with the cols button in the panel header. The default is deliberately narrow — pick the statistics that matter for what you are doing.
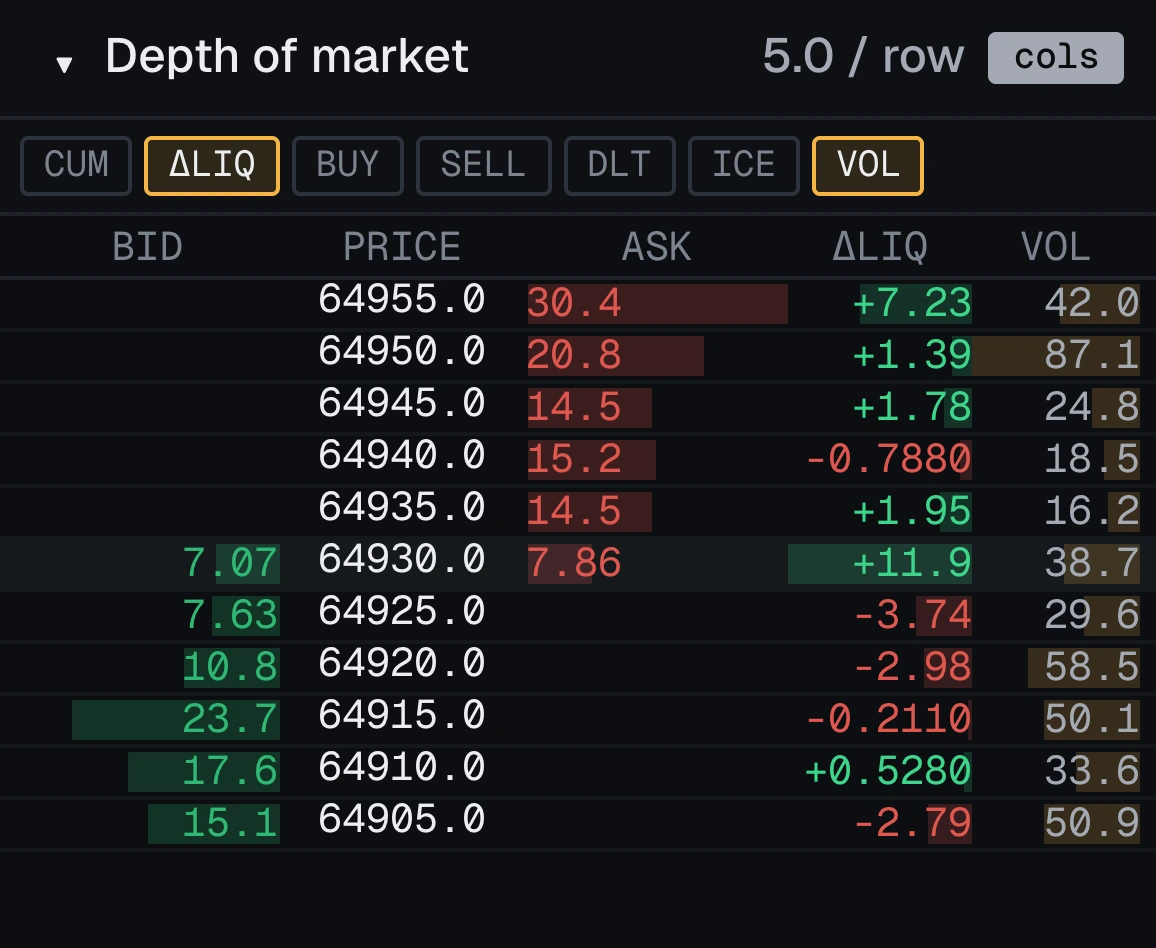
| Column | Means |
|---|---|
| CUM | Everything waiting between the touch and this level on the same side — how much an aggressive order would have to eat through to get here. |
| ΔLIQ | How much this level grew or shrank over the last twenty slices (two seconds at the default). Green grew, red shrank. A wall being quietly withdrawn shows here before it vanishes from the chart. |
| BUY / SELL | What actually traded at this price recently, split by which side was aggressive. |
| DLT | Those buys minus those sells, as one number. |
| ICE | The refill ratio: what traded here against the biggest size ever shown here. Under 1 is ordinary. Over 1, more has traded than was ever displayed — the iceberg signature. The number brightens when it goes over. |
| VOL | Everything traded at this price, both sides together. |
Each column draws a bar behind its number, scaled to the biggest value of that kind on screen, so every column stays readable.
During replay, the book columns (bid, ask, CUM, ΔLIQ) rewind with the chart. The traded columns do not — "where has business been done" is a question about the whole session.
Tape and alert sizing
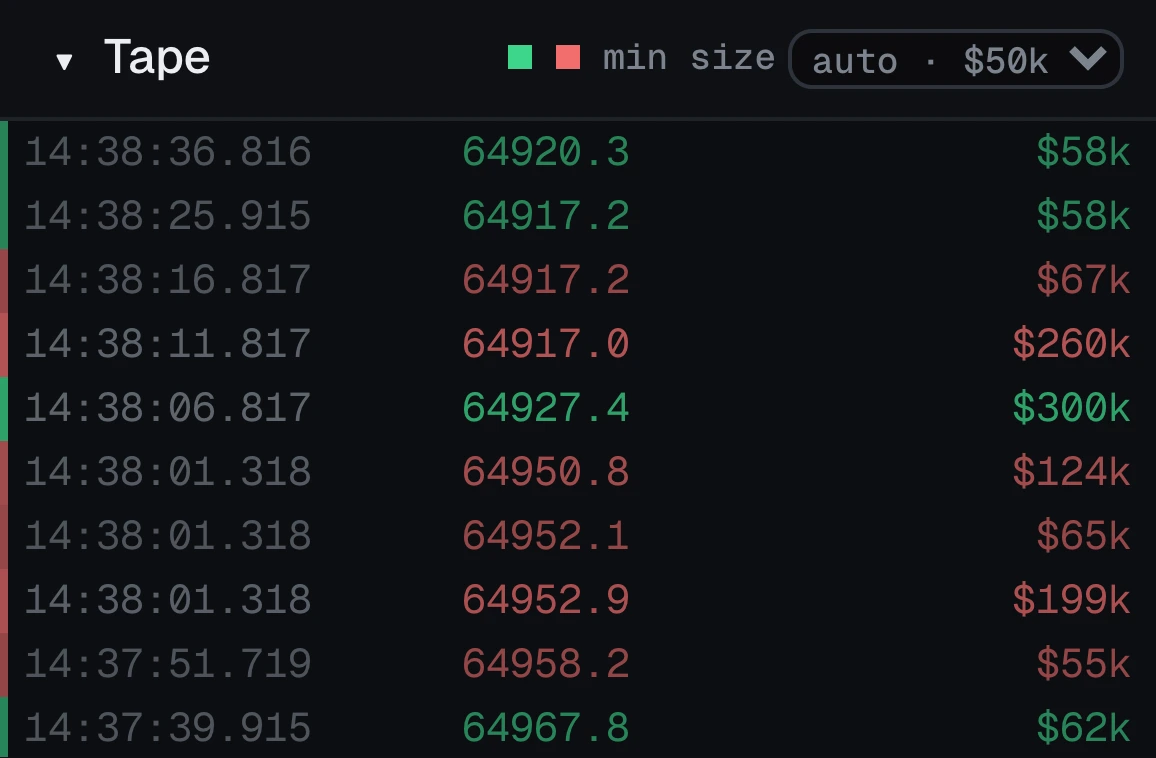
The tape lists every trade: time, price, and — most usefully — the dollar value of the trade. Exchanges report quantities like "0.0010", which means nothing on its own; "$80" means everything.
The min size control in the tape's header sets the floor that flow alerts must clear. On auto it picks a sensible floor from what this instrument has actually been printing, and re-picks automatically when you change symbol. Fixed floors run from $10k to $1M, and off shows everything.
The tape collapses to the same floor, so it shows the prints that were actually worth something rather than the firehose.

Liquidations
When a trader runs out of margin, the exchange closes their position for them. That forced trade is real volume that nobody chose to send, and it hits whatever the book looks like — which is why price sometimes travels further than the flow behind it seems to justify.
Turn on liqs in the toolbar. Each one is marked on the chart at the price and moment it printed, and listed in the flow panel as LIQ with the notional and which side died. The burst marker's spokes point the way the forced order pushed price.
| Reads | Means |
|---|---|
| long liquidated | A forced sell: a long position was sold out into the bids, pushing price down. A run of these is a cascade feeding itself. |
| short liquidated | A forced buy: a short position was bought back from the offers, pushing price up. This is what a squeeze is made of. |
Good to know
- They are not added to the tape, profile, delta or CVD. Those fills already arrived on the trade feed; counting them again would inflate every total.
- They pass a lower size bar than other alerts — a quarter of it — because somebody being forced out is informative at a size an ordinary trade would not be.
- They are a sample, not a census: every exchange publishes only some of its own liquidations, and the four exchanges below are the only ones that publish any.
Which exchanges publish them
6 of the 33 markets carry a public liquidation feed, and the terminal subscribes to every one of them. The rest publish none — a spot position cannot be liquidated, so on those the toggle is struck through rather than quietly empty.
| Exchange | Feed | What to expect |
|---|---|---|
| Binance USD-M Perpetuals | @forceOrder | Throttled and sampled by the exchange, and it has not been seen to deliver from every network. The rest of the Binance feed is unaffected either way. |
| Binance COIN-M Perpetuals | @forceOrder | Same stream and the same sampling as USD-M, on the coin margined contracts. |
| Bybit Perpetuals | allLiquidation | The most complete of the four. Confirmed working. |
| Bybit Inverse Perps | allLiquidation | As above, on the inverse contracts. |
| OKX Perpetuals | liquidation-orders | Published per instrument family rather than per symbol, so it arrives filtered. |
| BitMEX Inverse Perps | liquidation | Insert events only; an amended or cancelled liquidation is not a fill. |
Replay
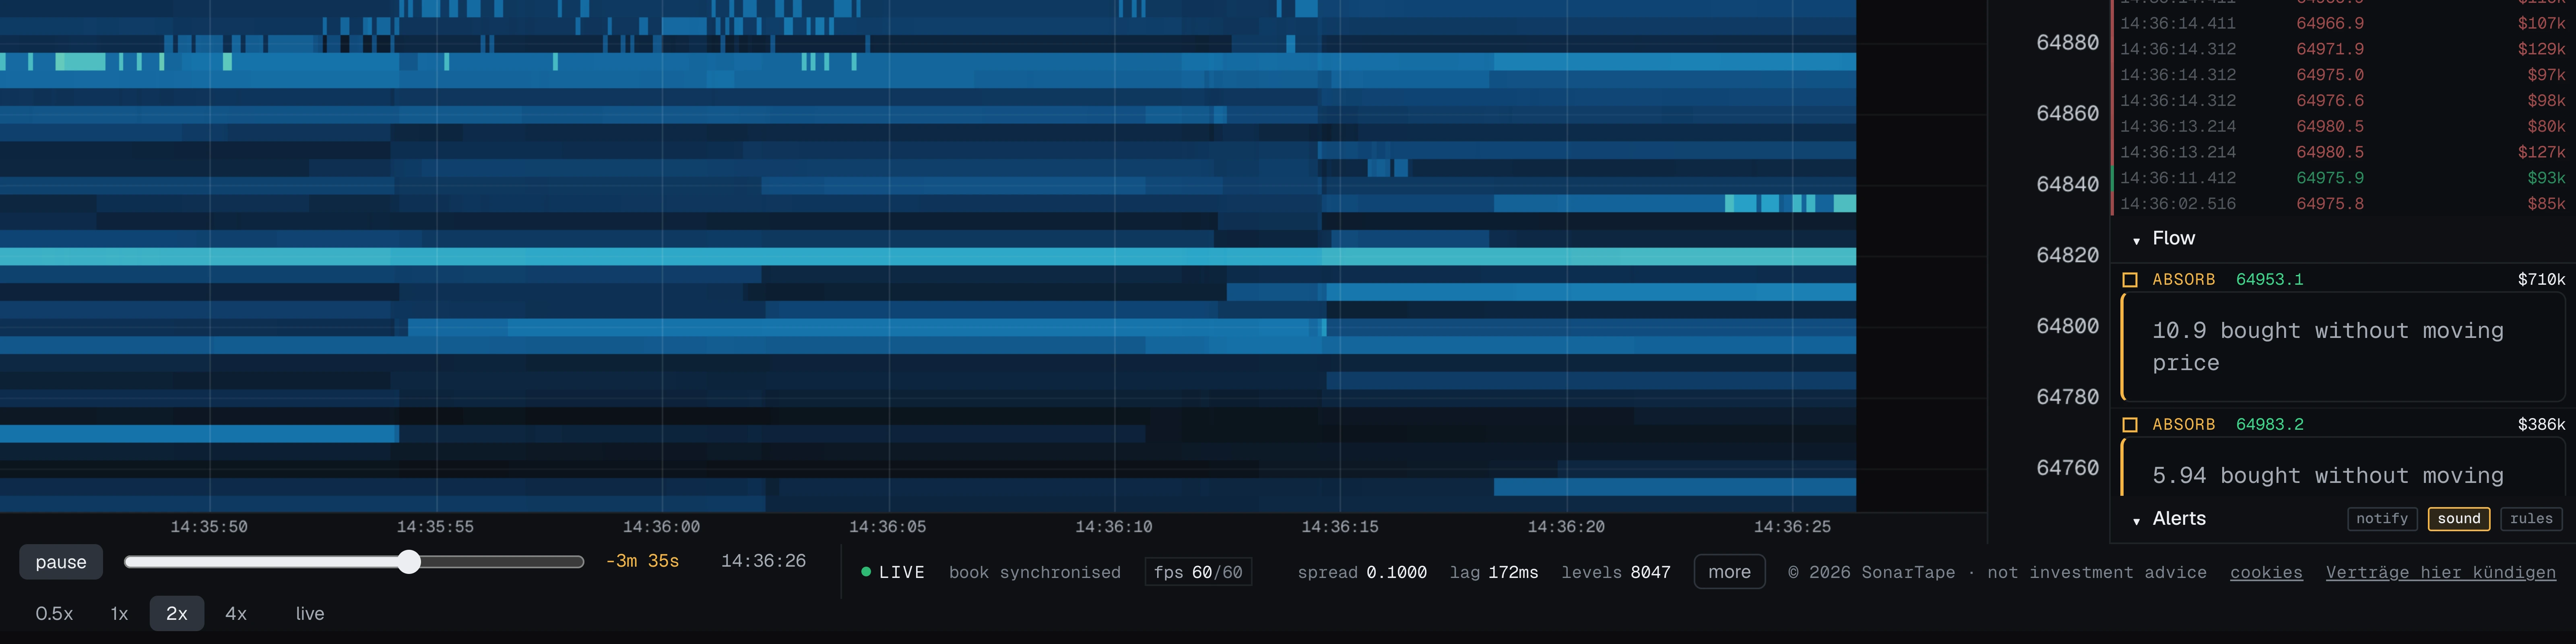
The chart keeps its recent history in memory, so you can pause, rewind and replay it — like a video, except it is built from the same data the live chart shows.
- Press Space to pause.
- Drag the scrubber to move anywhere in the kept history.
- Use the speed buttons to play forward at half, one, two or four times real speed.
What makes it useful: everything follows the cursor, not just the picture. The ladder shows the book exactly as it stood then, the tape stops at that moment, alerts only appear once the cursor reaches them, and the wall panel shows what had happened by then. You are not just re-watching a picture; you are re-living the data.
The live feed keeps running the whole time, so catching back up to live is instant — nothing is missed while you were in the past. The limit is how much history is kept, which is the plan limit.
Stop runs
Stops cluster behind the obvious levels — the high of the range, the low it bounced off, a round number. They are resting market orders, and a market order that has not fired yet is liquidity somebody can go and collect. That is what a stop run is: price is pushed through the level, the stops trigger and push it further, and then it comes straight back, because the move was never about where price belonged.
The awkward part is that the first half of that is identical to a real breakout. So this one waits. When a prior extreme breaks on a burst of one-sided aggression, nothing is reported; the read is armed. If price comes back through the level within the next while, STOPS fires. If it does not, the arm quietly expires — that was a breakout, and the panel says nothing about it.
| Part | What has to happen |
|---|---|
| The level | The highest or lowest the touch has been over the recent window, not counting the last stretch — otherwise price could never exceed its own extreme. The window is counted in columns, so it is about three minutes at the default hundred milliseconds a column, and longer at a coarser slice. |
| The burst | Aggression on the breaking side several times the window average. A level that gives way on ordinary flow has drifted through, not been run. |
| The reclaim | Price back through the level, soon enough to be the same move. |
The side points the way price went afterwards, not the way the burst went. A high that is run and rejected is a sell-side event, even though buying is what ran it — the buying already has a name, and it is SWEEP. The mark is drawn at the level that broke rather than where price is now, because the level is the thing worth remembering.
Spoof candidates
A PULLED wall is an order cancelled before it traded. Most of those are nothing: quotes are pulled all day, usually because the maker's own price moved and the order was never going to be hit anyway.
SPOOF? is the subset that is harder to explain that way. A large order appears, the market comes all the way to it, and it disappears without trading — it was shown to a market that was about to be able to take it, and then withdrawn. Three things have to be true at once:
- Price actually reached it. A wall cancelled with the market ten rows away was never tested. This is the one that separates the pattern from ordinary quote management, and it is measured over the whole life of the order — price can retreat in the same instant the order vanishes.
- It went essentially untraded. A level that took real fills before the rest was cancelled was honoured, however briefly.
- Most of it was cancelled outright, rather than quietly fading away.
When the same price does it repeatedly, the note counts it. Once is a candidate; the fourth time in five minutes is the part that is hard to read innocently.
Exchanges and data
Your browser connects to the SonarTape relay, which holds one upstream connection per exchange and symbol and streams the same data to every open terminal. That hop is what lets the feed be gated and what keeps latency low. Exchanges that refuse datacenter traffic — Binance and Bitget — are the exception: their feed is opened by your own connection, the same way the exchanges' own web terminals reach them. MEXC spot is the exchange that still needs a REST snapshot to seed its diff stream, and the relay fetches that; direct exchanges fetch theirs from the exchange itself.
| Exchange | Tag | Kind | Depth cadence | Snapshot depth |
|---|---|---|---|---|
| Binance USD-M Perpetuals | BINF | perpetual | 100 ms, 250 ms, 500 ms | 1,000 |
| Binance Spot | BINS | spot | 100 ms, 1000 ms | 5,000 |
| Binance COIN-M Perpetuals | BNCM | perpetual | 100 ms, 250 ms, 500 ms | 1,000 |
| Bybit Perpetuals | BYBF | perpetual | 100 ms | 500 |
| Bybit Spot | BYBS | spot | 100 ms | 200 |
| Bybit Inverse Perps | BYBI | perpetual | 100 ms | 0 |
| Coinbase Exchange | CBSE | spot | 100 ms | 0 |
| OKX Perpetuals | OKXS | perpetual | 100 ms | 0 |
| OKX Spot | OKXT | spot | 100 ms | 0 |
| Bitget Perpetuals | BGSF | perpetual | 150 ms | 0 |
| Bitget Spot | BGSS | spot | 150 ms | 0 |
| Gate.io Perpetuals | GTFU | perpetual | 100 ms | 0 |
| Gate.io Spot | GTSP | spot | 100 ms | 0 |
| BitMEX Inverse Perps | BMEX | perpetual | 100 ms | 0 |
| Deribit Perpetuals | DRBT | perpetual | 100 ms | 0 |
| Deribit USDC Perps | DRBU | perpetual | 100 ms | 0 |
| Kraken Futures | KRKF | perpetual | 100 ms | 0 |
| Kraken Spot | KRKS | spot | 100 ms | 0 |
| Hyperliquid | HYPE | perpetual | 100 ms | 0 |
| dYdX v4 | DYDX | perpetual | 100 ms | 0 |
| KuCoin Futures | KCFU | perpetual | 10 ms | 0 |
| KuCoin Spot | KCSP | spot | 10 ms | 0 |
| MEXC Perpetuals | MXCF | perpetual | 100 ms | 0 |
| MEXC Spot | MXCS | spot | 100 ms | 5,000 |
| Bitfinex Spot | BFXS | spot | 100 ms | 0 |
| Bitfinex Perpetuals | BFXP | perpetual | 100 ms | 0 |
| Crypto.com Spot | CDCS | spot | 300 ms | 0 |
| Crypto.com Perpetuals | CDCP | perpetual | 300 ms | 0 |
| Bitstamp | BTSP | spot | 100 ms | 0 |
| HTX Spot | HTXS | spot | 200 ms | 0 |
| Gemini | GEMI | spot | 100 ms | 0 |
| Poloniex | PLNX | spot | 100 ms | 0 |
| HitBTC | HBTB | spot | 100 ms | 0 |
Two quirks worth knowing
- Binance's aggregated trade stream is silent — it connects but never delivers. The adapter uses the plain trade stream instead, which carries the same buy/sell information; trades just arrive one by one rather than bundled.
- Coinbase changed how it labels the buyer and seller between its old feed and its new one. Rather than guess which one is live, the app classifies each trade by where it traded: at or above the ask = a buy, at or below the bid = a sell. Simple and always right.
The same exchanges also list stocks, indices and commodities; see Stocks, indices and commodities for what those books are.
Stocks, indices and commodities
Most of the exchanges above now list perpetuals and tokenized shares on traditional assets beside their coins: NVIDIA (NVDA), Tesla (TSLA) and several hundred more stocks and ETFs, the S&P 500 and the Nasdaq 100, gold, silver, crude and natural gas. They stream the same full depth and the same taker-tagged prints as BTC, so every part of the terminal works on them unchanged. They are included from Pro.
Finding them
Pick an exchange that lists them, open the symbol picker and choose stocks, indices, commodities or fx above the list, or type the ticker or the name: nvidia and gold find NVDAUSDT and XAUUSDT. Each market is listed with its plain name where we know it, taken from the names Bybit publishes for its own markets and written by hand for commodities, indices and currencies; a ticker we cannot name with confidence is shown bare rather than guessed. Each exchange spells them its own way:
- Binance, Bybit, Bitget, Gate.io: perpetuals named like coins,
NVDAUSDTorNVDA_USDT. Bybit spot also lists xStocks shares,NVDAXUSDT. - OKX: perpetuals as
NVDA-USDT-SWAP, and tokenized shares on spot asXNVDA-USDT. - Hyperliquid: on its builder-deployed exchanges, with the exchange’s name in front:
xyz:NVDA,xyz:GOLD,xyz:SP500. - KuCoin, MEXC, Deribit, Kraken futures:
NVDAUSDTM,AAPLSTOCK_USDT,NVDA_USDC-PERPETUALandPF_NVDAXUSD.
What these books are, and are not
Each one is that crypto exchange’s own market on the asset: its resting orders and its prints, settled in stablecoins. It is not Nasdaq’s book or CME’s, and it is much thinner than either. Real-time depth on the listed markets themselves is a licensed product (Nasdaq TotalView, CME depth) with per-user fees, which is why it is not here.
Price follows the underlying through each exchange’s index and funding, and most of these markets trade around the clock, nights and weekends included, when the stock exchange is closed. Expect the book to thin out outside US market hours, and the thinnest markets, often the tokenized spot shares, to go minutes between prints.
Which exchange decides the class
The class shown in the picker comes from each exchange’s own metadata, so an ETF is filed under stocks and a leveraged ETF can land under indices where the exchange files it that way. Hyperliquid publishes no class, so its builder markets are sorted by name, with anything unrecognised filed under stocks. Binance tokenized spot shares, Gate.io spot and the other spot lists carry no class at all and appear as ordinary symbols.
Status bar and performance
The status bar along the bottom shows the connection on the left, performance in the middle, and feed numbers on the right.

Performance
- on screen — how much time the chart is showing, e.g. "42s". Wheel zoom changes this.
- fps — frames drawn per second, over your screen's refresh rate. While the chart is live it should sit at your refresh rate. Scrolled back into history it reads zero on purpose: nothing is moving, so nothing is drawn. Click it to force constant drawing if you want to measure performance.
- slice/s — how many book samples per second arrive. Data speed, not display speed.
- draw — how long one paint takes. Turns amber when it is too slow. The tooltip shows the worst recent paint.
Feed
- spread — best ask minus best bid right now.
- msg/s — raw messages arriving from the exchange per second.
- row — the price covered by one heatmap row (the price / row setting).
- vwap — the session average, same as the VWAP overlay.
- pressure — the book imbalance as a signed percentage.
- lag — delay between the exchange's clock and yours; differs per exchange.
- levels — how many raw price levels the exchange is publishing.
- window — how much history is kept, which is how far replay reaches.
- session delta — buys minus sells since the page opened.
- resyncs — how often the book had to be rebuilt from a snapshot. A few an hour is normal; bursts are not. Appears only once it has happened.
Plans and limits
The terminal has a free tier: live, without a card, on BTC and ETH at a 500 ms slice and 120 rows of depth. The paid tiers are what open every exchange and the panels built on the feed, and either one starts with 7 free days when billed yearly. History is measured in columns, because columns are what cost memory. At the 50 ms slice Pro keeps 5m of history, and replay reaches back exactly that far.
| Included | Free | Pro | Elite |
|---|---|---|---|
| In every tier | |||
| Replay of the retained window | yes | yes | yes |
| Pro adds | |||
| Stocks, indices and commodities | — | 2,600+ markets, 24/7 | 2,600+ markets, 24/7 |
| Retained window at 50 ms | — | 5m | 10m |
| Volume profile, delta and footprint | — | yes | yes |
| Saved workspaces | — | 50 | 50 |
| Real time exchange coverage | BTC and ETH, 2 exchanges | all 33 markets, live | all 33 markets, live |
| Retained slices | 600 columns | 6,000 columns | 12,000 columns |
| Fastest slice interval | 500 ms | 50 ms | 50 ms |
| Depth tracked per side | 120 rows | 2,000 rows | 2,000 rows |
| Elite adds | |||
| Block, sweep, absorption and refill detection | — | — | yes |
| Walls, stop runs and spoof candidates | — | — | yes |
| Liquidations | — | — | Binance · Bybit · OKX · BitMEX |
| Alert rules | — | — | yes |
Enforcement is at the relay: the market data only leaves our infrastructure for a signed in session, clamped to what that session's plan carries — which for free means a short instrument list as well as the coarser slice and shallower band. What the browser does with what it receives is product shaping; what it can receive at all is the plan. Direct exchanges — Binance and Bitget, which refuse datacenter traffic — are the exception: their stream is opened by your browser and never passes our infrastructure, so it is offered to everyone. The plans carry the same table with explanations.
Account and billing
Accounts exist so your subscription follows you between browsers — for nothing else. The homepage demo runs signed out; the terminal is what the account entitles you to.
- Signing in is handled by Clerk — email and password, or a social provider.
- Paying is handled by Stripe Checkout, so your card details never reach this app.
- Changing or cancelling happens in the Stripe billing portal, reachable from your account page. Cancelling runs to the end of the paid period, then the terminal closes.
- After checkout the app may take a few seconds to notice the upgrade, because the payment confirmation can arrive a beat after the redirect. A refresh settles it.
Troubleshooting
The chart stays on CONNECTING
Relay exchanges reach the browser through the relay, so geography rarely matters: Bybit streams fine even where its own endpoints are blocked. Binance and Bitget are opened by your own connection, so they do depend on your network — on a network that blocks them the chart stays dark while every relay exchange still works. If every exchange hangs, a corporate network is probably blocking WebSockets. A "subscription required" detail means the session is not entitled — sign in, or check your account page.
The heatmap is one flat colour
Two fixes, in order: put price / row back on auto, then move the sensitivity slider until only the big levels glow.
The coloured band is narrower than the screen
The feed only publishes so far from the price — that is the book rows setting. Raise it, or zoom back in.
The chart cleared itself
Changing price / row, slice or book rows changes what the stored data means, so the chart rebuilds. Changing symbol or exchange does the same. That is expected, not a bug.
fps reads zero
You are scrolled back into history and nothing is moving, so nothing is drawn. Double click, or press L, to return to live.
The flow panel stays empty
Two normal reasons. The detectors need about forty trades before "bigger than usual" means anything, so a fresh page is quiet for a moment. And the min size floor may be above what this instrument prints — put it on auto or off and it fills in.
No liquidations appear
Four exchanges publish them: Binance, Bybit, OKX and BitMEX, on their perpetuals only. Bybit is the most complete of the four; Binance's forced-order stream is sampled and does not deliver from every network; spot markets publish none at all, because a spot position cannot be liquidated. The full list of feeds is under liquidations.
Support
The Help button in the terminal and in the site header lands here. Read troubleshooting first — most of what support is asked is on that list, and the answer is faster than we are. For anything else, write below.
Say which exchange and symbol, what you expected and what you saw. A screenshot of the status bar along the bottom of the terminal answers most of the follow-up questions in one go: it carries the exchange, the row step, the slice rate and the connection state.
Feature requests belong here too — pick Feature request under About and say what you are trying to read in the market rather than which control you want; that is the part we cannot guess, and it is what decides whether a request gets built.
You can also write directly to [email protected].
Billing
Subscriptions, invoices, cards and cancellation are self service through the billing portal on your account page — that is Stripe's own portal, so it is immediate and does not wait on us. Write to support only if the portal disagrees with what you were charged.
What we cannot help with
Nothing here is investment advice, and no one on this side will tell you what a level means for a trade you are thinking about. Exchange-side problems — an outage, a delisted symbol, an API change — we can confirm and work around, but not fix.
Not built yet
Named here rather than implied anywhere in the product.
- Saving recordings to disk. Replay covers the kept history only. Keeping more than that means writing it to a file, which is not built yet.
- A saved-layout interface. The storage for saved workspaces exists and is plan limited; nothing in the interface calls it yet.
- Multiple charts side by side.
- Numbers drawn inside heatmap cells at high zoom. The data is already there — the crosshair reads it out.